
 Facebook Ads
 TikTok Ads
 Shopify
How we increased conversion value by 146.9% and ROAS by 27.1% for an online fashion store
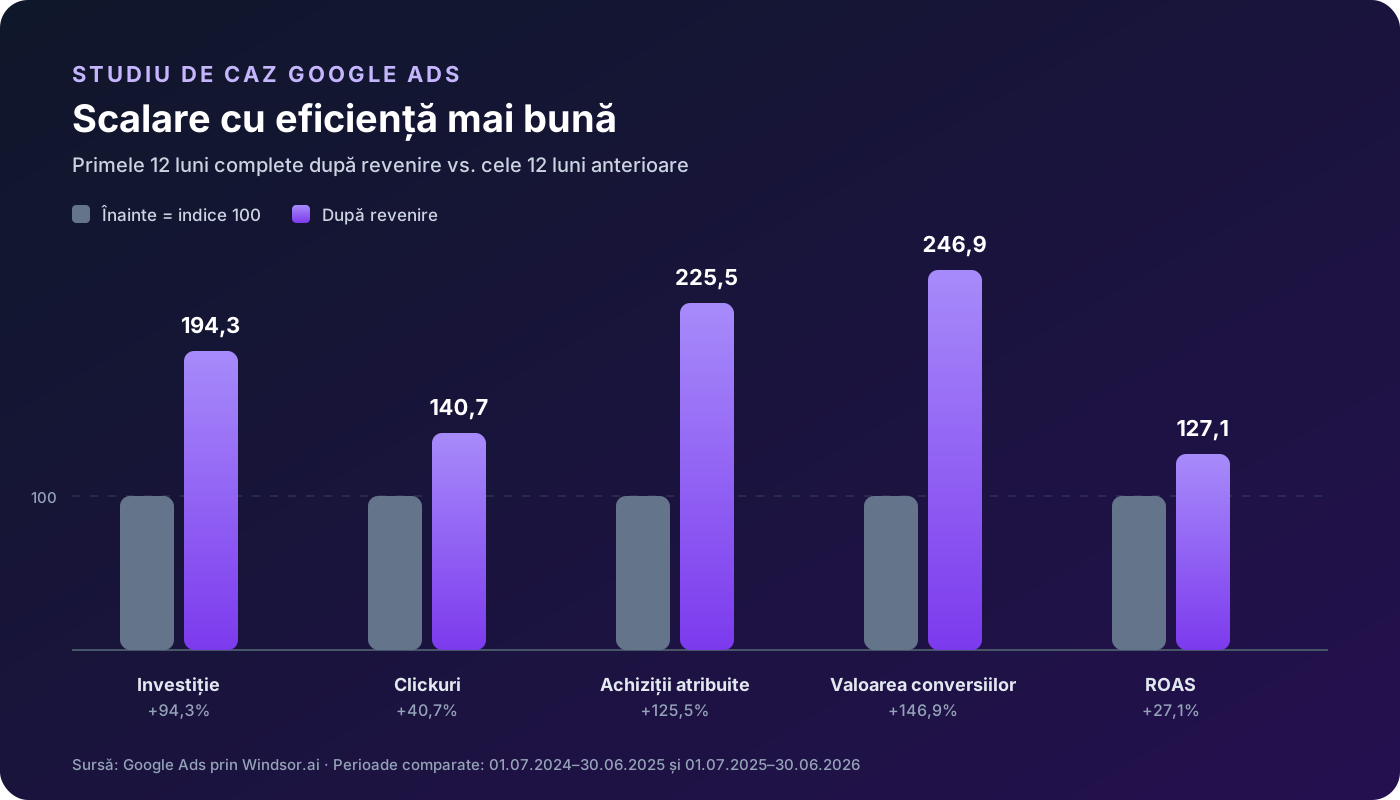
A Romanian online fashion store with an extensive catalog and strong seasonality. The Google Ads account was created by ALLSoft Agency, managed elsewhere for a period, then returned. We compare the first 12 complete months after its return (1 July 2025–30 June 2026) with the preceding 12 months. Results represent Google Ads attribution, not the store's net revenue or profit. The name and domain are not published.
Results at a glance
What do you do when a Google Ads account built by your team is managed elsewhere for a period, then returns? You do not erase its history and start from zero. You verify measurement, separate brand demand from campaigns that can scale and use historical data to make better decisions. We do not name the brand or publish the budgets or absolute commercial values for the two periods.
| Metric | 12 months before | 12 months after return | Change |
|---|---|---|---|
| Media investment | index 100 | index 194.3 | +94.3% |
| Clicks | 71,903 | 101,170 | +40.7% |
| Attributed purchases | 1,875.43 | 4,229.63 | +125.5% |
| Conversion value | index 100 | index 246.9 | +146.9% |
| Google Ads conversion rate | 2.61% | 4.18% | +60.3% relative |
| CPA | 21.21 RON | 18.27 RON | −13.8% |
| Google Ads ROAS | 10.70× | 13.60× | +27.1% |
Periods compared: 1 July 2024–30 June 2025 and 1 July 2025–30 June 2026. Figures represent conversion value attributed by Google Ads, not store revenue.
The context: an account with history, not a project started from scratch
The brand is a Romanian online store with an extensive fashion catalog and strong seasonality. Demand changes with weather, collections, promotions and product availability. A structure that works in winter cannot automatically receive the same budget in summer.
The Google Ads account was originally created by the team managing it today. A period of external management followed, after which the brand returned. We do not name the other team or turn the study into criticism. We use this context only to define two comparable windows.
We checked the entire available account history, from 27 June 2022 to 21 August 2026. The central comparison uses two 12-month windows to reduce distortion from seasonality and earlier tracking changes.
Progress by year
The annual history shows three distinct stages: initial construction, external management and the return followed by scaling. Figures below are reported by Google Ads. 2026 is partial, through 21 August 2026.
| Year | Advertising spend | Primary conversions | Conversion value | ROAS | CPA | Interpretation |
|---|---|---|---|---|---|---|
| 2022* | 11,224.15 RON | 1,129.00 | not comparable | — | 9.94 RON | account construction and tracking in transition |
| 2023* | 26,501.21 RON | 2,114.57 | 349,595.79 RON | 13.19× | 12.53 RON | purchase tracking stabilized in the second half of the year |
| 2024 | 52,798.71 RON | 2,313.92 | 515,933.96 RON | 9.77× | 22.82 RON | scaling with lower efficiency |
| 2025 | 43,634.13 RON | 2,468.30 | 601,623.68 RON | 13.79× | 17.68 RON | mid-year return and acceleration in Q4 |
| 2026** | 56,149.14 RON | 2,714.64 | 690,617.15 RON | 12.30× | 20.68 RON | 1 Jan.–21 Aug., incomplete year |
* In 2022 and the early months of 2023, conversion configuration is not fully comparable with the current period. Values are shown for historical transparency, not to calculate uplift between years.
** 2026 is partial and must not be compared directly with a complete calendar year.
The foundation
The first spend appears in the account on 27 June 2022. The initial Search and Performance Max layers were built in the second half of the year, and the account began accumulating data on products, searches and seasonality.
Google Ads reports 1,129 primary conversions on 11,224.15 RON spent. Primary conversion value is almost empty in the current historical configuration, however, while "All conversions" contains additional values. This indicates an earlier tracking change.
Stabilizing measurement and accumulating signals
In 2023, investment reached 26,501.21 RON, and Google Ads reported 2,114.57 primary conversions and 349,595.79 RON in conversion value.
The purchase action used today becomes visible in the data from September and aligns almost fully with the "Conversions" column from October. Q4 created the first robust window for subsequent comparisons. This is also the basis from which we can discuss ROAS and CPA with greater confidence.
Higher budget, normalized efficiency
In 2024, Google Ads spend reached 52,798.71 RON, almost double 2023. The platform attributed 2,313.92 conversions and 515,933.96 RON in conversion value.
Annual ROAS was 9.77×, and CPA was 22.82 RON. It was a year of greater coverage and budget, without the same proportional increase in conversions. We do not use this period to criticize another team; we use it as an objective baseline for what happened after the return.
The return and the turning point
The brand returned to the team that originally built the account in mid-2025. For the public comparison, we use 1 July 2025 as the start of the first complete window after the return.
2025 closed with 43,634.13 RON in spend, 2,468.30 attributed conversions and 601,623.68 RON in conversion value. Annual ROAS rose to 13.79×, while CPA fell to 17.68 RON.
The acceleration becomes clear in Q4: October–December totaled approximately 23,857 RON invested and 391,596 RON in conversion value, for ROAS of around 16.41×. It was more than a budget spike; efficiency increased alongside volume.
Scaling around a stable core
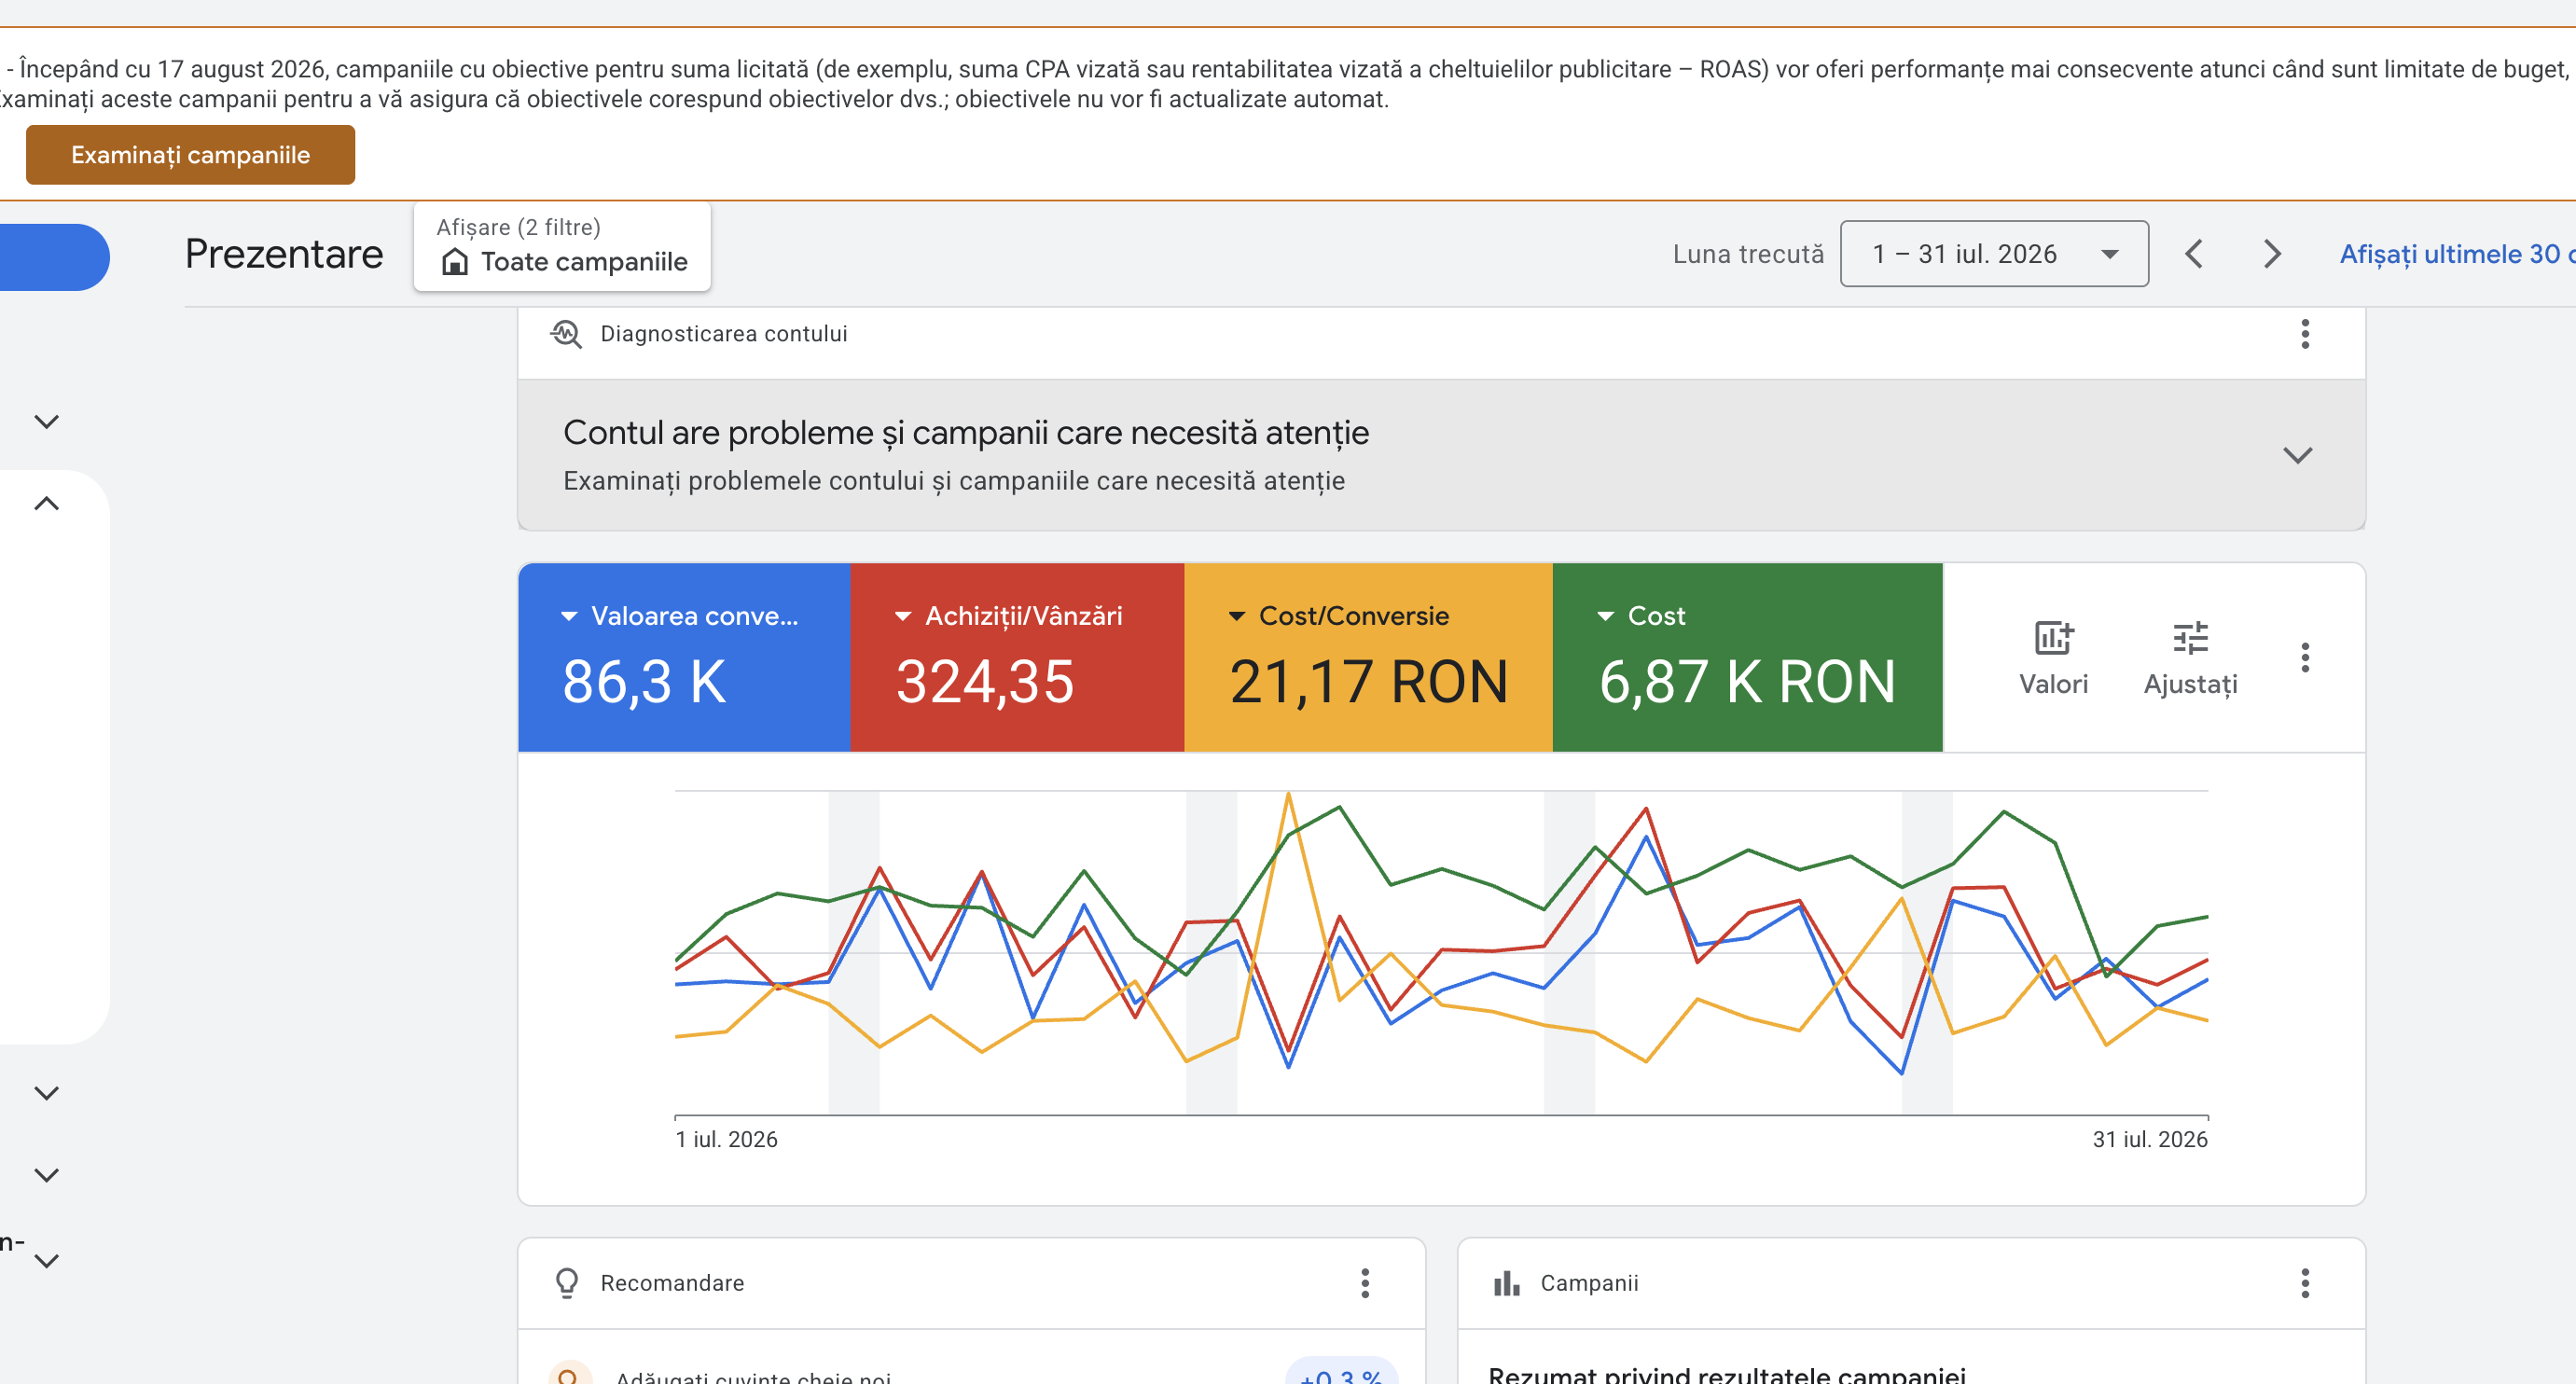
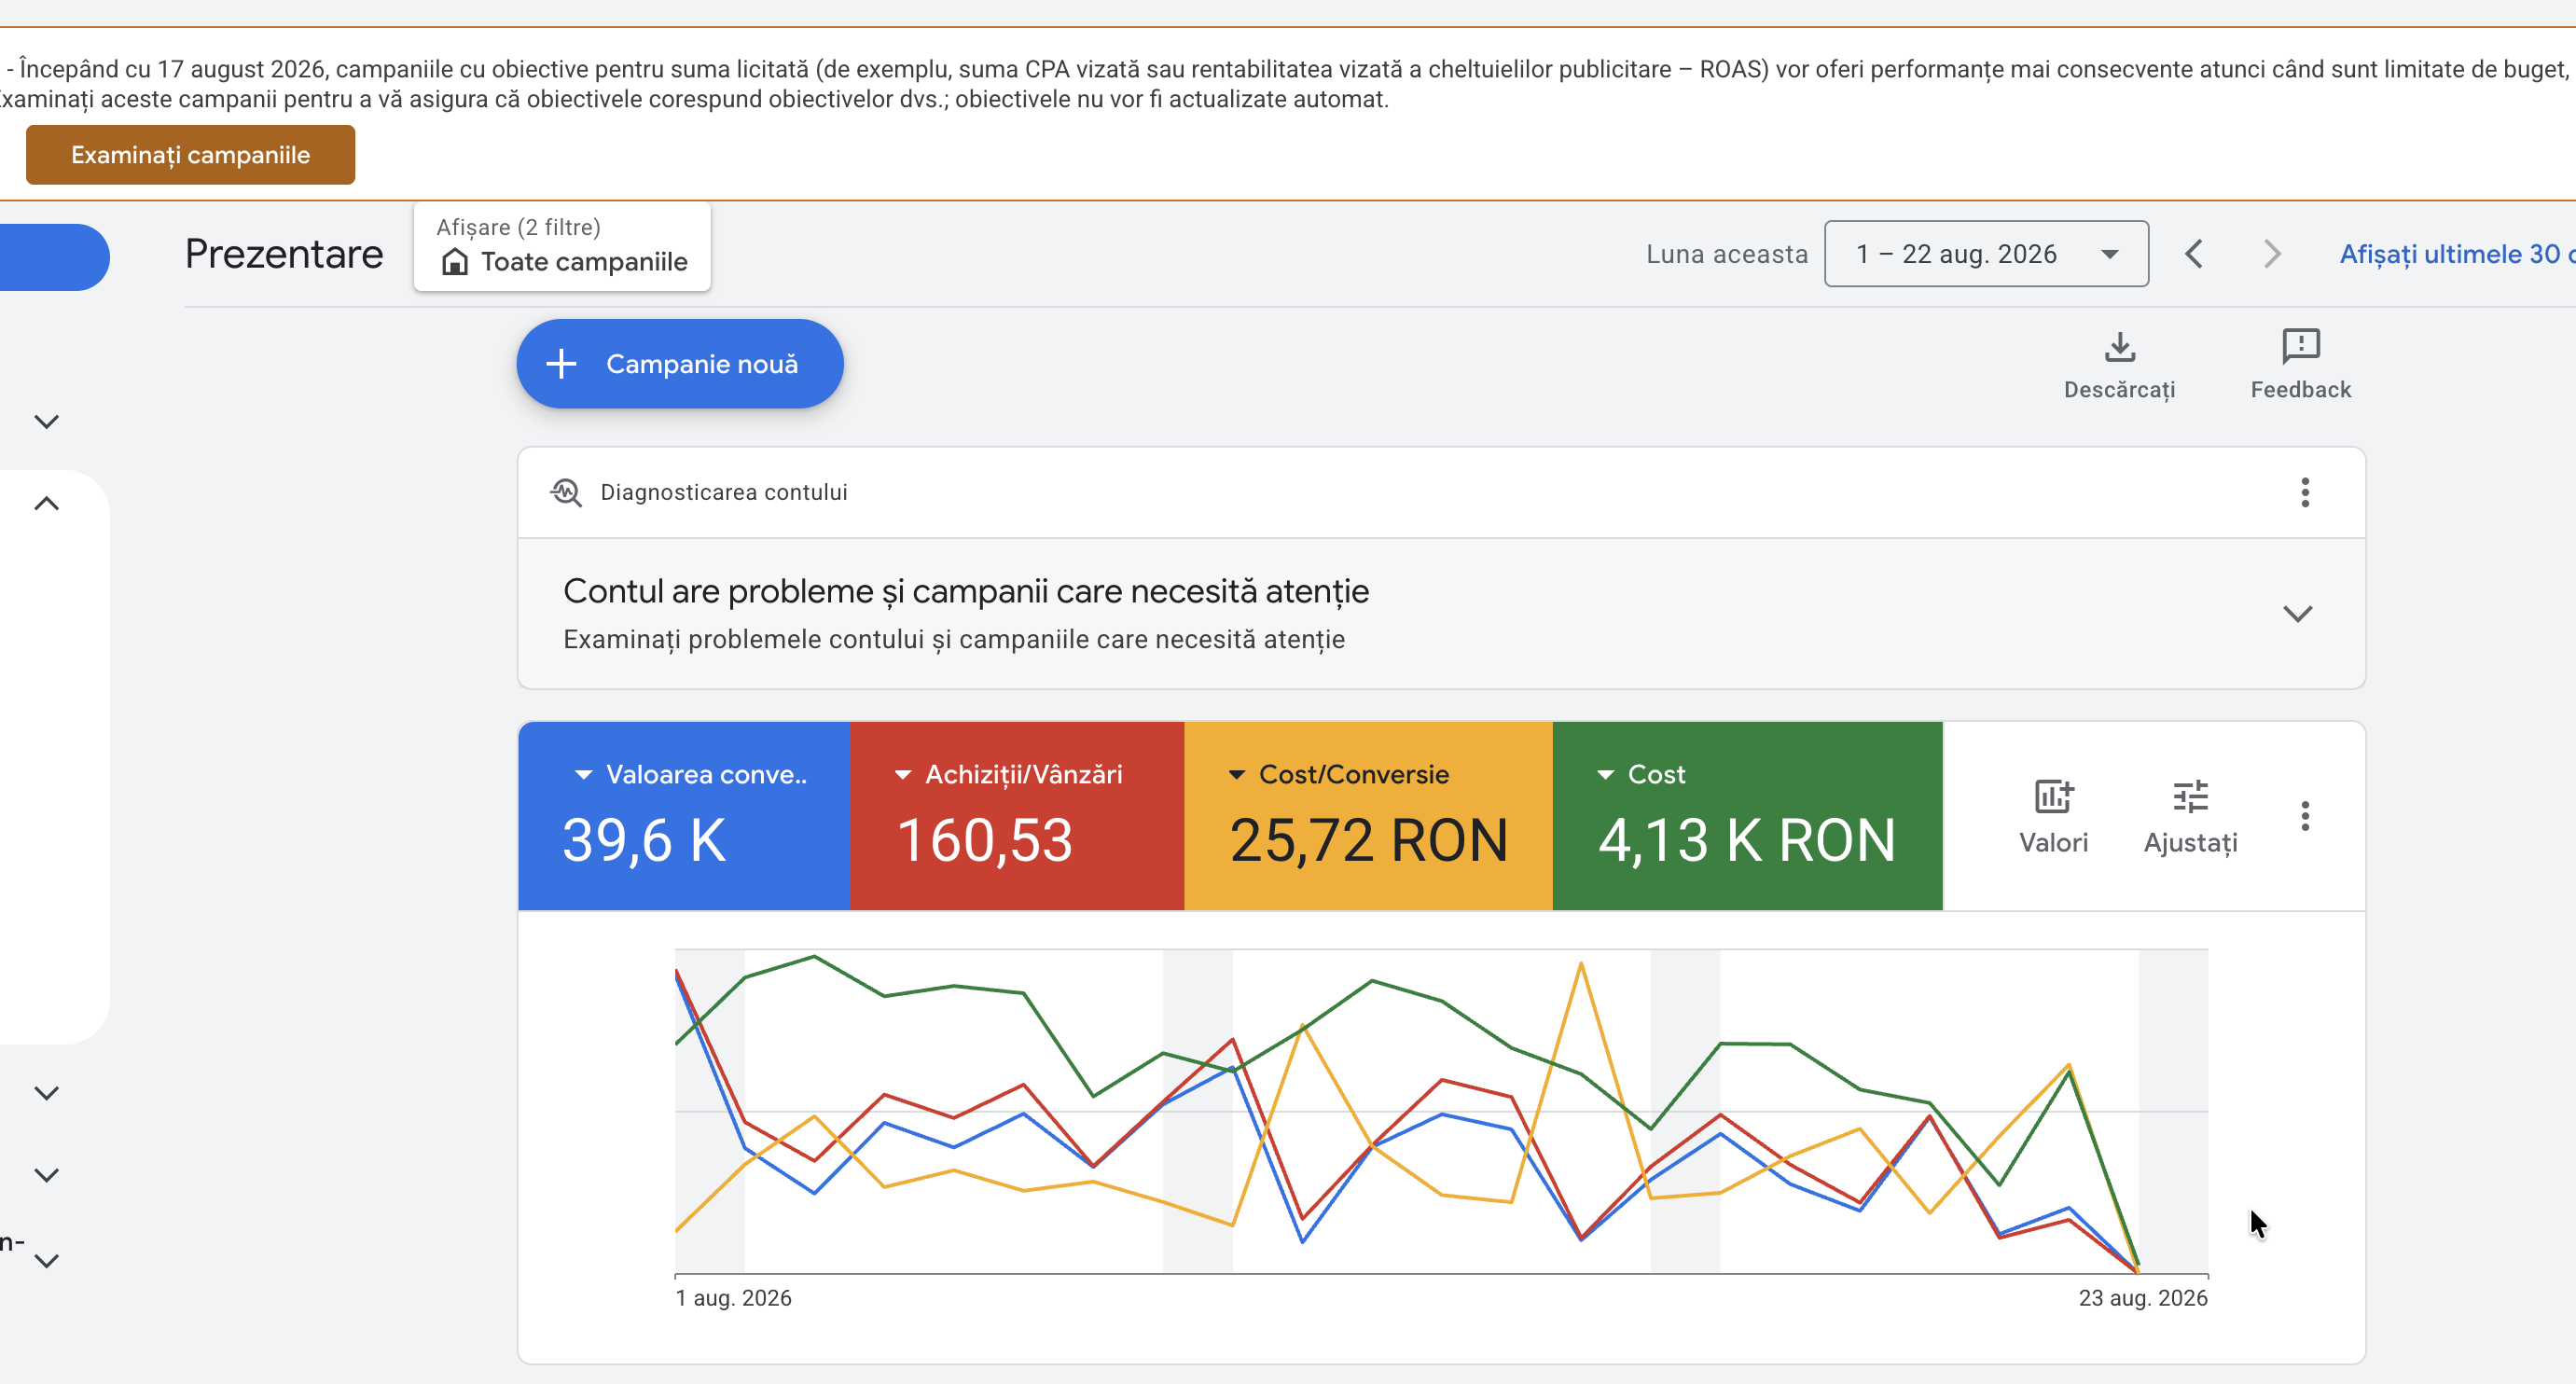
Between 1 January and 21 August 2026, Google Ads reported 56,149.14 RON in advertising spend, 2,714.64 primary conversions and 690,617.15 RON in conversion value, with ROAS of 12.30× and CPA of 20.68 RON.
Between 1 January and 21 August 2026, the account had already exceeded the full year of 2025 in both conversions and attributed value. We do not compare percentages from a partial year with a complete year; we use this observation only as a volume indicator.
The challenge: scaling without breaking efficiency
When we resumed management, the objective was more than an attractive ROAS on a small budget. We needed to increase volume while keeping acquisition cost under control.
Three things made the project difficult: the catalog and demand changed seasonally; brand demand was highly efficient but could not sustain growth alone; and the history contained measurement changes, so "All conversions" could not be used as a purchase total without the risk of double counting.
We therefore separated measurement from the marketing story. For results, we used only the primary purchase action included in the Conversionscolumn, not the secondary actions in All conversions.
The Google Ads strategy
We preserved the history and clarified the data
A mature account has valuable signals: searches, products, peak periods, campaigns that scaled and campaigns that stopped. Instead of losing them through an artificial restart, we used the history to identify the role of each campaign type.
For analysis, we treated the primary purchase action as the source for purchases and value. The GA4 purchase import was configured as a secondary action at the verification date, so we did not add it to the primary total.
We separated demand capture from catalog scaling
The post-return structure had distinct roles: Search to protect brand demand (highly efficient, but treated as demand capture), Performance Max for the full catalog (the main volume engine), Performance Max for validated categories, Dynamic Search Ads to cover remaining queries, and seasonal campaigns activated and paused according to collection and demand.
In the 12 months after return, the two main Performance Max layers used approximately 60% of the budget. The brand campaign consumed only 10.3%but reported ROAS of 30.93×. We do not use this figure as evidence that the entire account can scale at 30×: brand captures existing demand, while real volume growth came from the complete mix.
We optimized for value, not cheap clicks
Active campaigns used bidding aimed at maximizing conversion value. CPC rose from 0.55 RON to 0.76 RON (+38.1%). If we had tracked only click cost, the post-return period would have looked worse.
But conversion rate rose from 2.61% to 4.18% (+60.3% relative). Improved traffic quality and value offset the higher click cost: CPA −13.8%, attributed purchases +125.5%, conversion value +146.9%.
Seasonal campaigns as extensions, not the foundation
In fashion, a good seasonal campaign may have a short window. Keeping it active after demand or the catalog has changed consumes budget and dilutes the signal.
We built an always-on core and added layers for autumn, winter and summer. When a category no longer justified investment, the campaign was paused and the budget returned to validated areas.
What changed in the first 12 complete months after return
Investment almost doubled, but performance grew faster than the budget:
Why we do not use the "All time" total as the headline
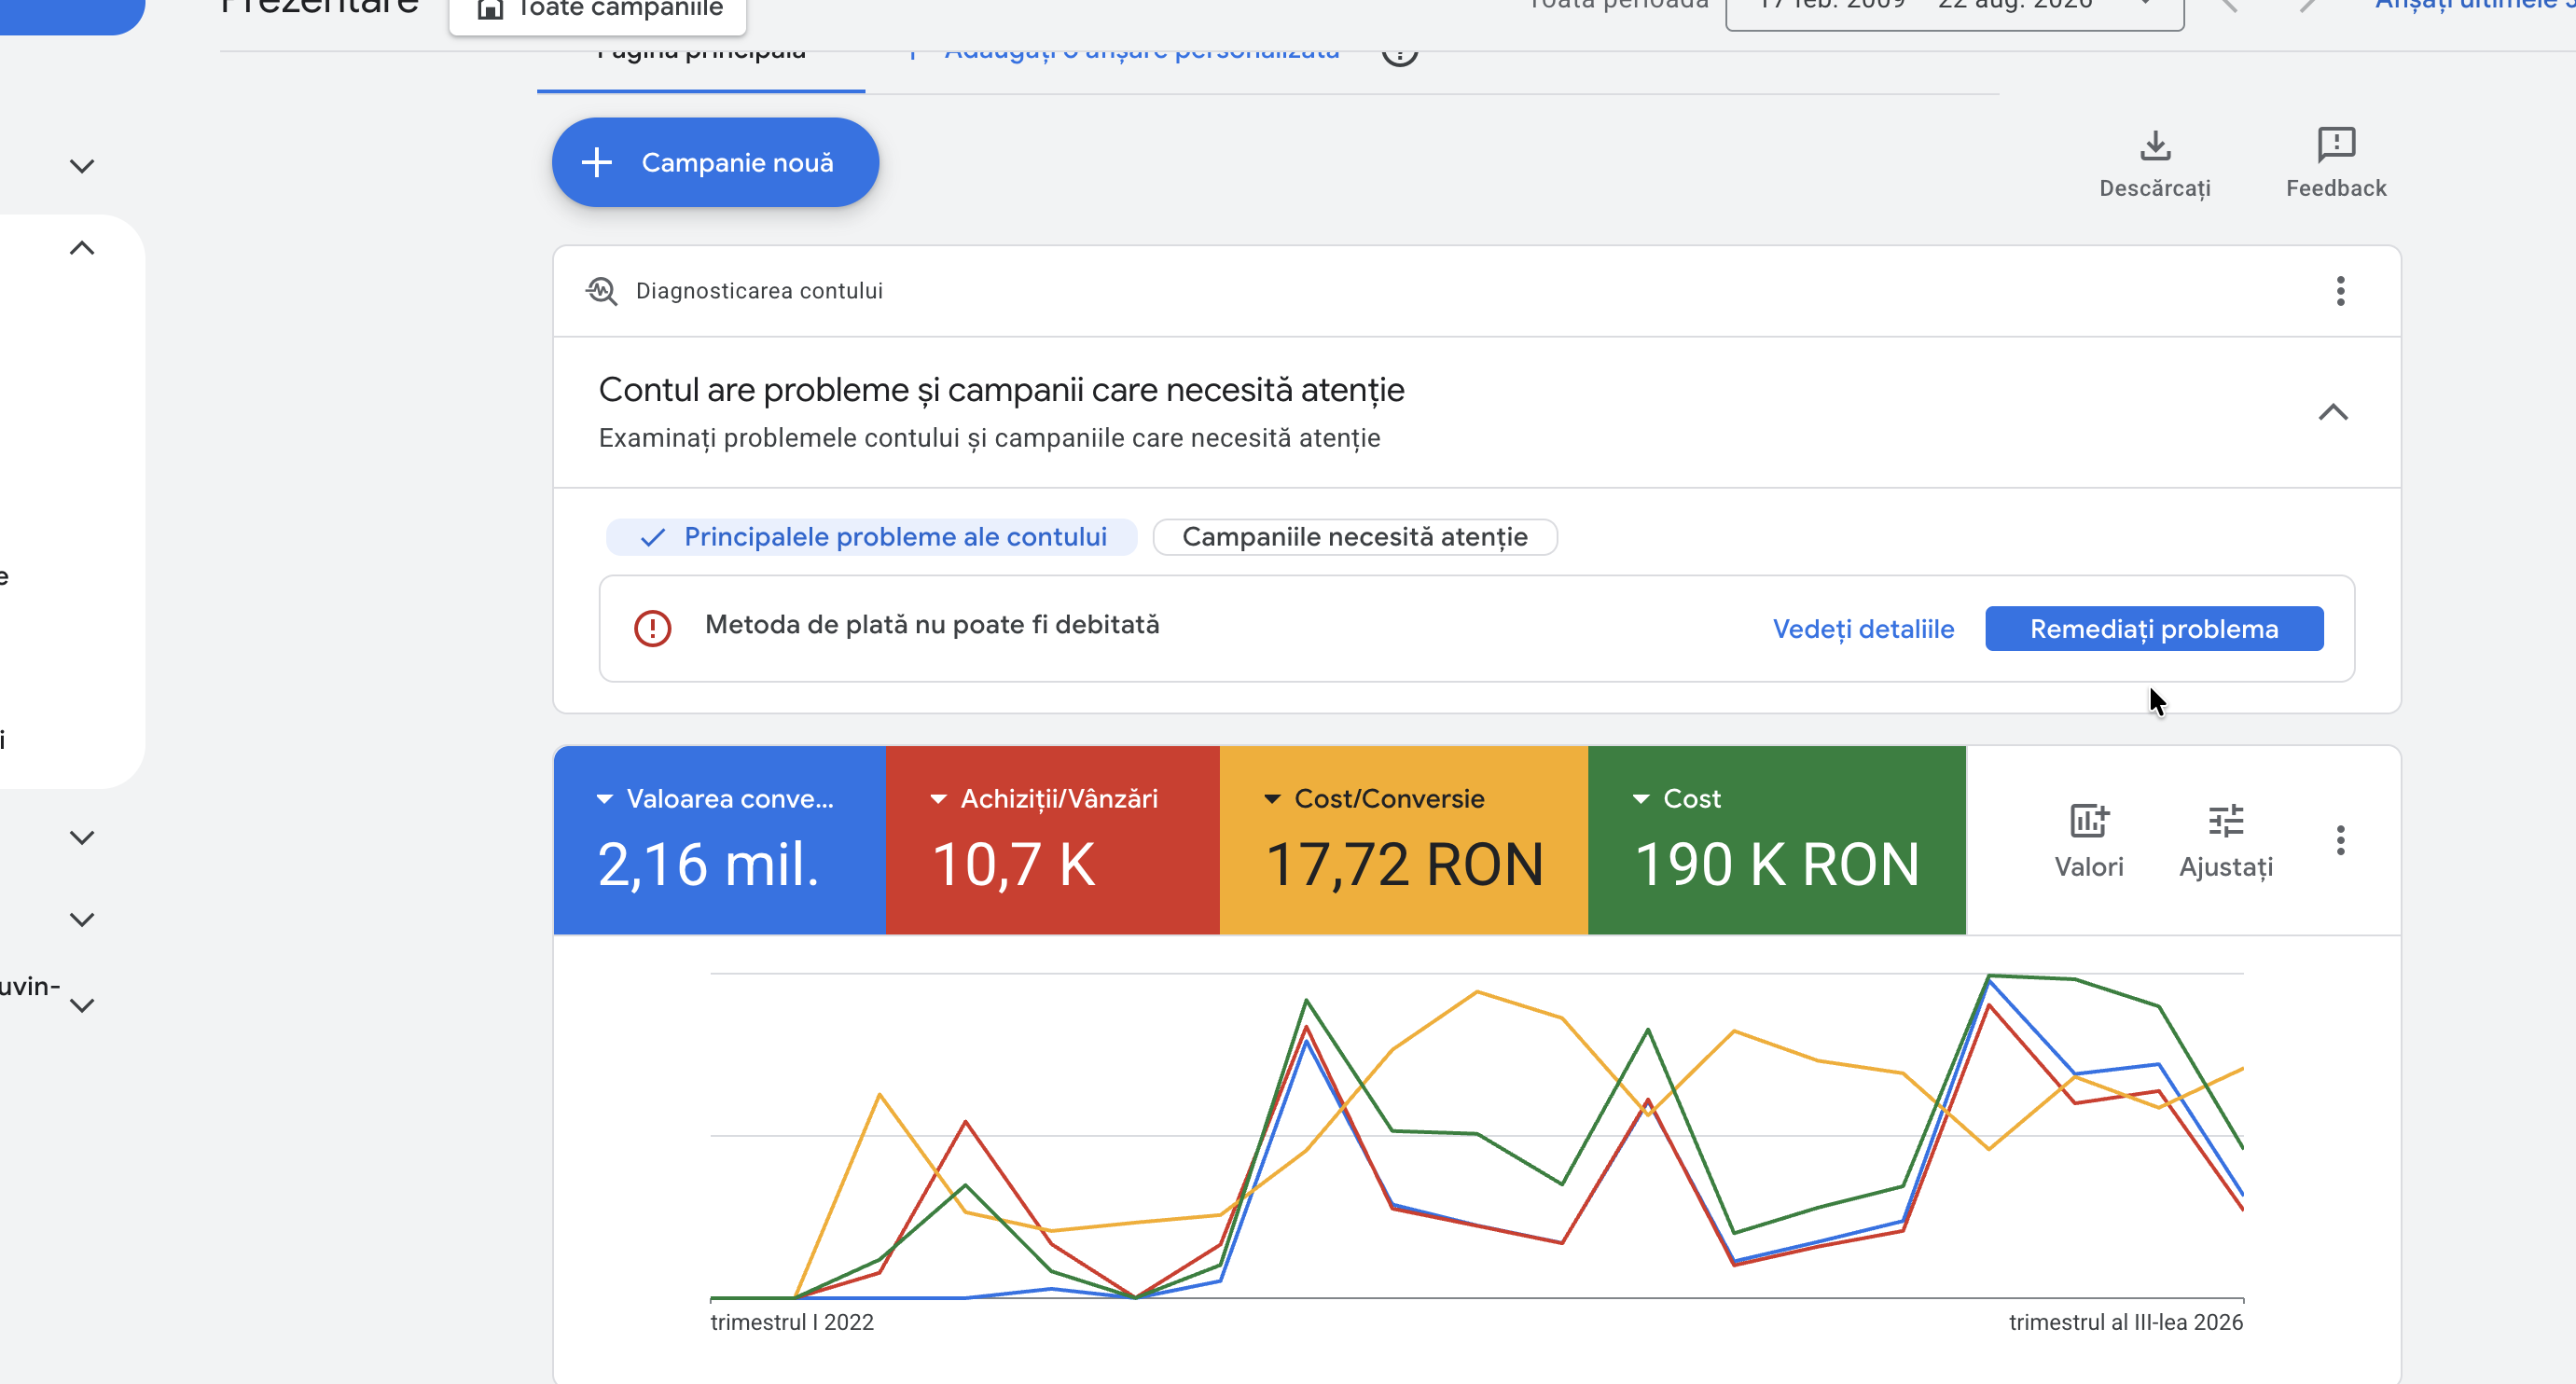
For 27 June 2022–21 August 2026, the Google Ads interface shows 190,307.34 RON in advertising spend, 10,740.43 primary conversions, 2,157,778.59 RON in primary conversion value and a calculated ROAS of 11.34×.
These figures are real in Google Ads reporting, but not fully comparable across the entire period. Conversion actions and values changed in 2022 and the early months of 2023. We therefore do not present the raw total as the main evidence or calculate an "uplift" between years with different tracking.
For the study's conclusion, we chose two complete, equal and recent periods with a consistent primary purchase action.
What we can and cannot say
Based on live Google Ads data, we can say
- the platform attributed 2.26 times as many purchases after the return;
- attributed value was 2.47 times higher;
- platform ROAS increased despite investment almost doubling;
- CPA fell.
We do not say
- that conversion value is net revenue, profit or demonstrated incremental revenue;
- that the analysis is reconciled with the store, canceled orders, returns, margins or other channels;
- that the pre/post comparison is a controlled test: the offer, stock, seasonality and website may affect the result.
The project conclusion
"The account did not need a dramatic reset. It needed continuity, correct measurement and a structure that could grow without letting brand demand mask the rest of the performance. In the first 12 complete months after return, investment grew 94.3%, while conversion value attributed by Google Ads grew 146.9%. ROAS rose from 10.70× to 13.60×, and CPA fell from 21.21 RON to 18.27 RON. This is not a promise that every account can repeat these figures. It is evidence that an account with history can be taken back and scaled without sacrificing efficiency."
Frequently asked questions
What type of business does the study cover?
A Romanian online fashion store with an extensive catalog and seasonal demand. The name and domain are not published.
Which periods were compared?
1 July 2024–30 June 2025 and 1 July 2025–30 June 2026. Two consecutive, complete 12-month windows.
Why do purchases have decimal places?
Google Ads can distribute conversion credit across several interactions using data-driven attribution. This is why platform reports can display fractional conversions.
Is conversion value the same as store revenue?
No. It is the value attributed by Google Ads according to platform settings. Net revenue, profit or MER require reconciliation with the store's commercial system.
Why is the account's return relevant?
Because it shows that performance did not start from a new account. The team resumed management of an account with history, preserved useful signals and compared the first 12 complete months with the preceding 12 months.
Did the agency change alone produce all the growth?
We cannot demonstrate exclusive causality through a pre/post comparison. The data supports a clear improvement after the return, but the offer, stock, seasonality and website may also contribute to the result.
Want to scale Google Ads without losing control of efficiency?
ALLSoft Agency works with the account's real history, separates conversions used for bidding from secondary signals and scales budget around the areas producing value.
Methodology and limits
Data comes from the store's Google Ads account, read-only through Windsor.ai on 22 August 2026. The account timezone is Europe/Bucharest and currency is RON. The verified history is 27 June 2022–21 August 2026; the current day, 22 August 2026, was excluded. The main comparison uses 1 July 2024–30 June 2025 and 1 July 2025–30 June 2026. Purchases and value use the Google Ads "Conversions" column, based on the primary purchase action; the GA4 purchase action was secondary and was not added. ROAS = conversion value / advertising spend; CPA = advertising spend / conversions; conversion rate = conversions / clicks. Google Ads data has not been reconciled with the store, returns, cancellations, margins or other channels. The study is anonymous.