
 Facebook Ads
 TikTok Ads
 Shopify
From RON 6.62 million to RON 45.01 million annually in four years
How a Romanian premium furniture brand built, together with ALLSoft Agency, a multichannel growth system. Between 1 January and 21 August 2026, the store reached RON 28.34 million in Shopify sales, 35.8% above the same period in 2025.
OpenAI Approved Advertiser status indicates approved advertising access, not a partnership certification.
2022
May 2022. The turning point — visible in the chart, beyond the narrative.
ALLSoft Agency took over the accounts in May 2022. Until April, sales tracked alongside 2021. From May, the trajectory diverged: 2022 total sales closed at RON 12.79 million, +93.2% versus 2021, with more than half the difference coming from the final 8 months. The monthly pace in May–December was approximately 2.4× the January–April average — a change that coincided with the takeover and campaign restructuring.
Annual snapshot
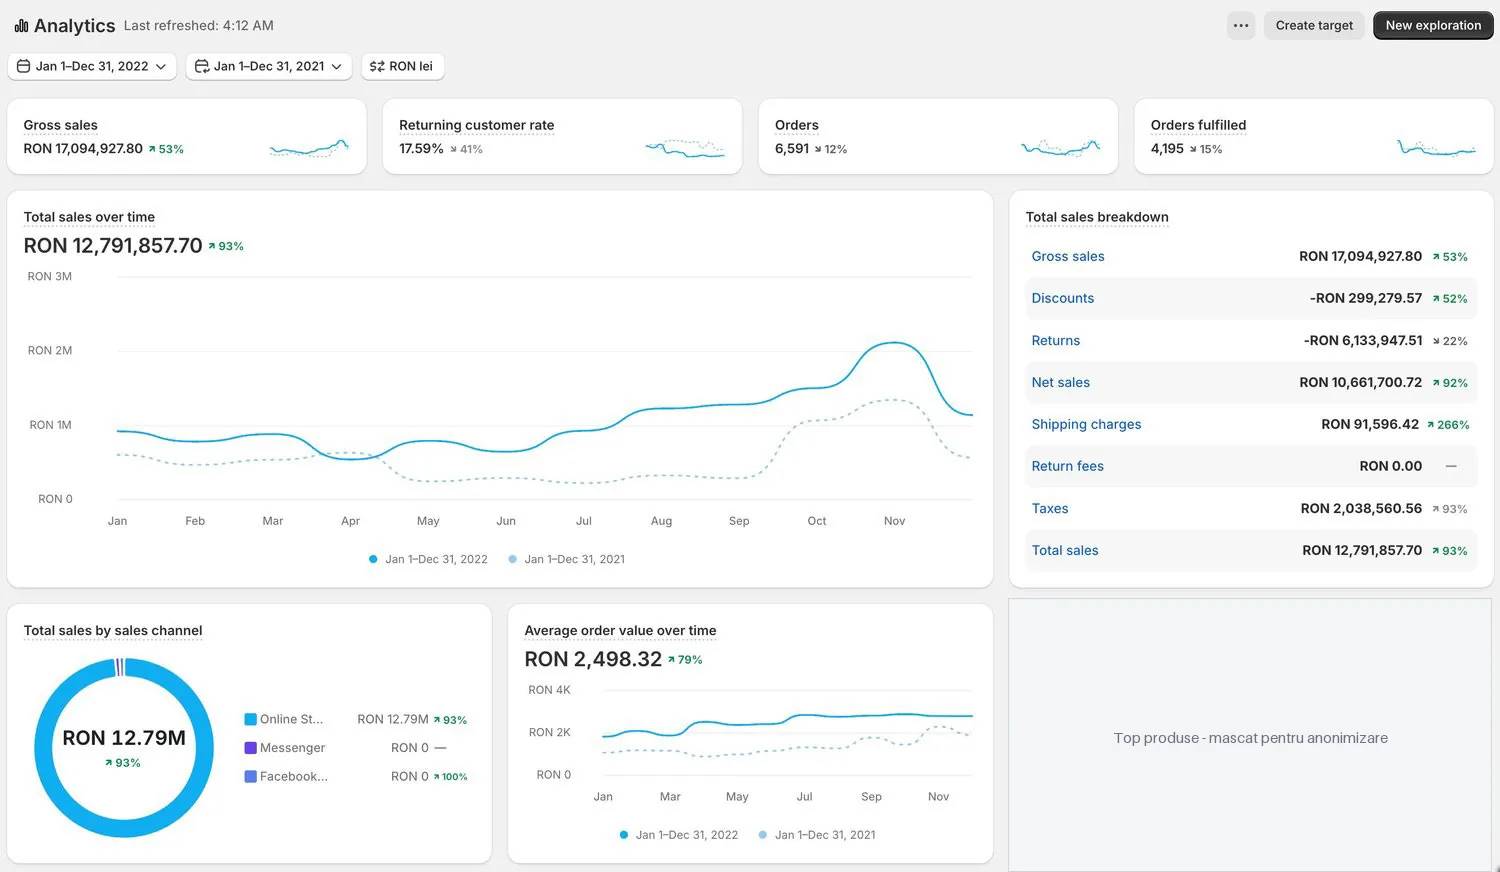
The turning point · 2021 → 2022
Until April 2022, sales tracked alongside 2021 — the same rhythm, peaks and declines. From May, the trajectory visibly diverged.
January–April 2022 kept pace with 2021 at approximately RON 550 thousand/month. May–December 2022 generated around RON 10.6 million in 8 months, averaging RON 1.32 million/month — a monthly pace approximately 2.4× the start of the year, coinciding with ALLSoft Agency taking over.
The pattern: fewer orders, higher AOV versus 2021 and a lower returning customer rate — consistent with a strategy of higher-value customer acquisition, the direction that defined the first 8 months.
Performance by channel
Meta Ads
Historical Meta data for 2022 is unavailable. Ad account history is retained from January 2023 onwards, so this period is marked unavailable rather than estimated. The operational lesson: from 2023, automated monthly exports to cloud storage for all accounts managed by ALLSoft Agency, without relying on platform retention.
Google Ads
TikTok Ads
TikTok joined the mix in 2024. In 2022, the strategy remained Meta + Google.
Email · Klaviyo
Klaviyo access lost. Email migrated to Shopify Email in 2023. Historical Klaviyo data for 2022 is no longer accessible at account level, so the period is marked unavailable.
2022 strategic context
Foundational decisions, May–December 2022
Restructuring the ecosystem in the first 8 months: acquisition with rising AOV, full-funnel Meta scaling, Google Ads with brand protection and non-brand campaigns, and offers positioned towards larger baskets.
The operational lesson
Losing pre-2023 Meta history became a lasting lesson. From 2023, automated monthly exports to cloud storage for every account managed by ALLSoft Agency, without relying on platform retention.
The 2022 lesson
“The real turning point appears in the monthly curve, not just annual totals. May 2022 split the business trajectory into two, and the story that followed started there.”
2023
Scaling acquisition. +152% sessions, +21.5% sales, +5% orders.
2023 combined a substantial traffic expansion with a year-end peak. Sessions rose +152% YoY, orders +5%, Shopify-reported AOV +8% and total sales +21.5%, to RON 15.54 million. November delivered RON 4.08 million in one month — 26% of the year — with data indicating the infrastructure absorbed a peak of roughly 4× the monthly average. We tested a Hydrogen migration, encountered consent mode v2 and tracking issues, returned to the Shopify theme and recovered during Black Friday season.
Annual snapshot
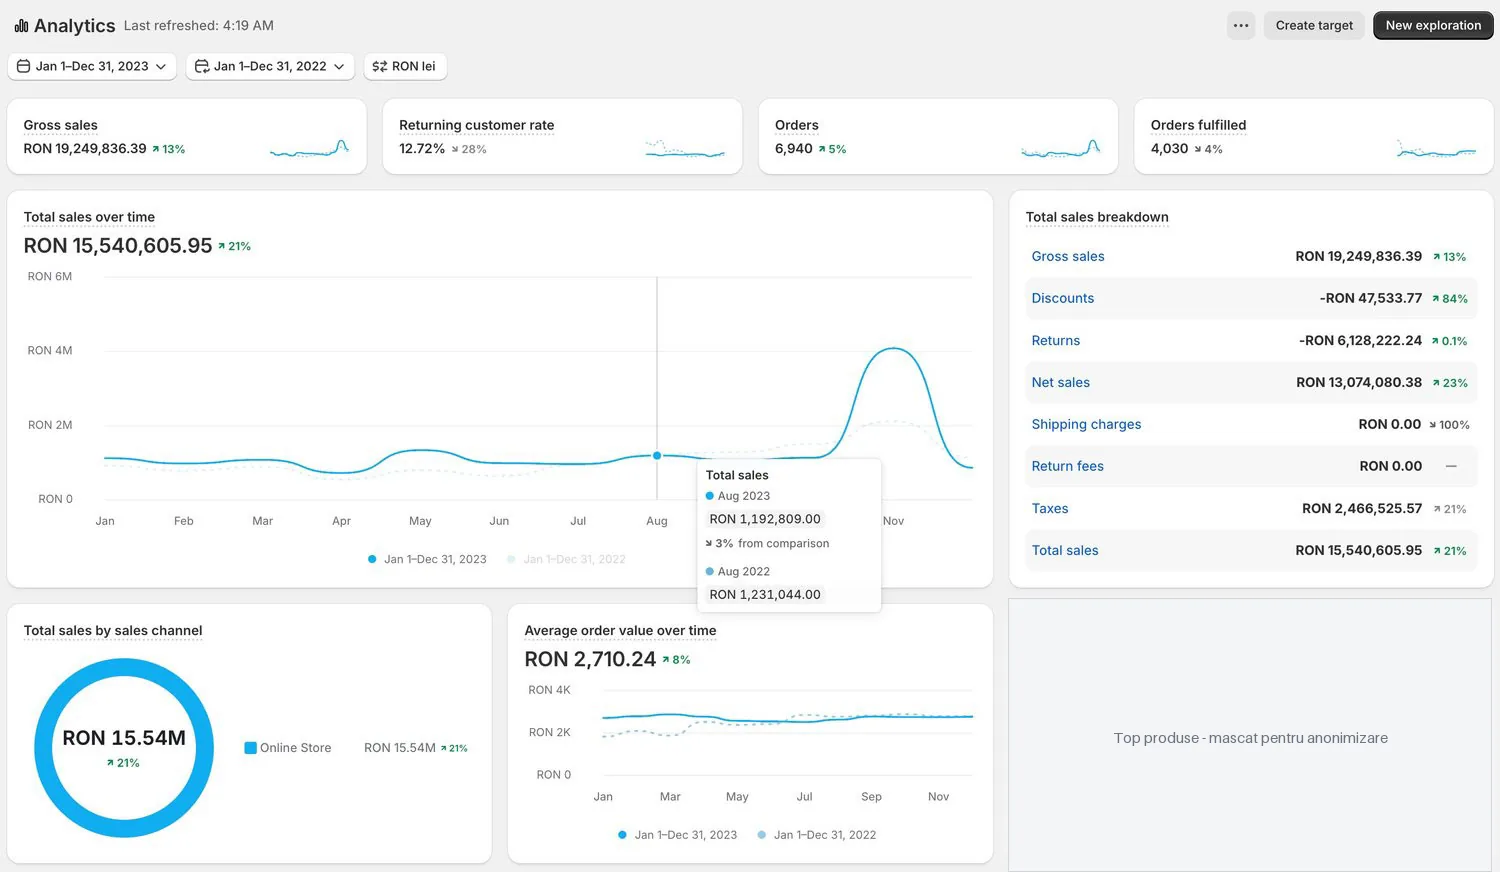
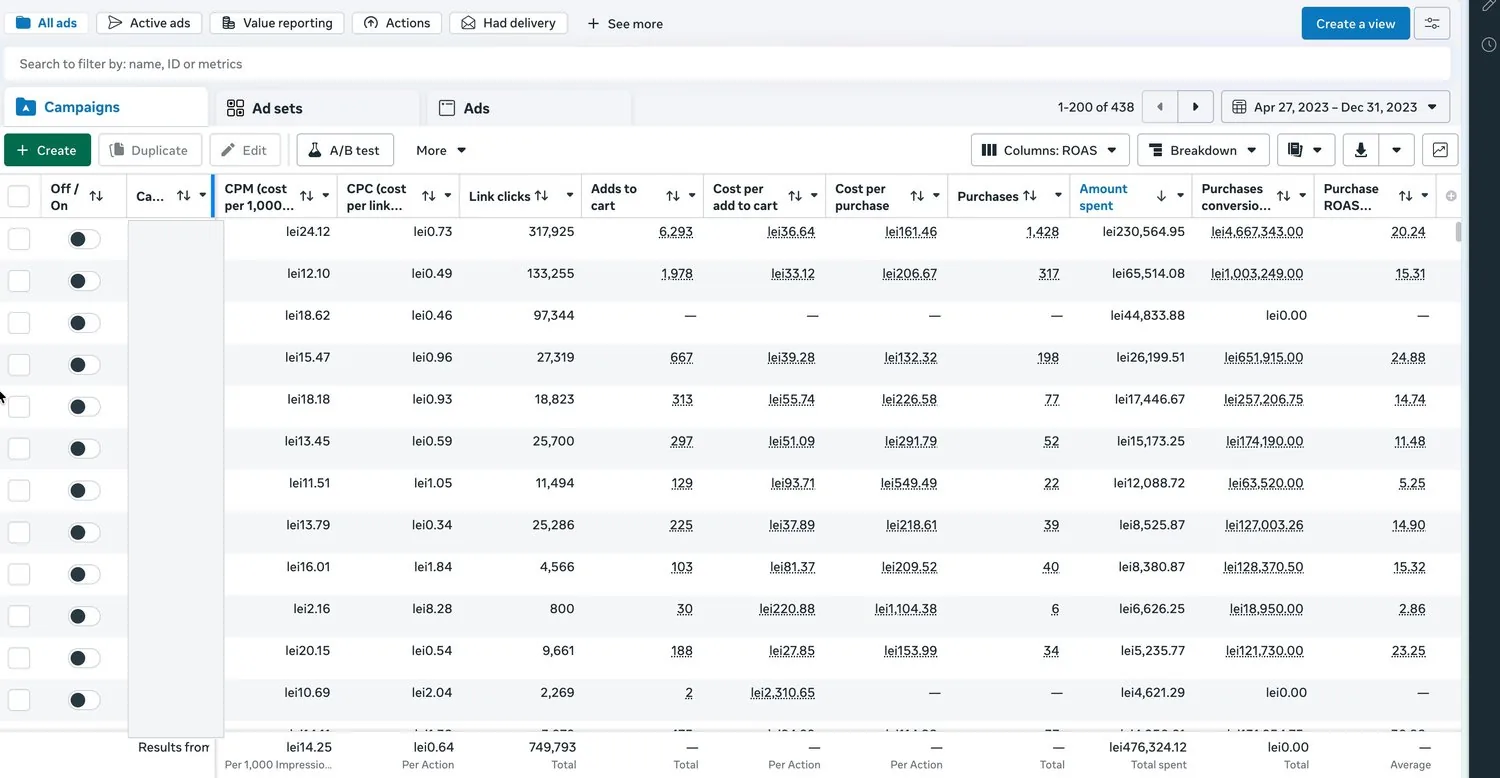
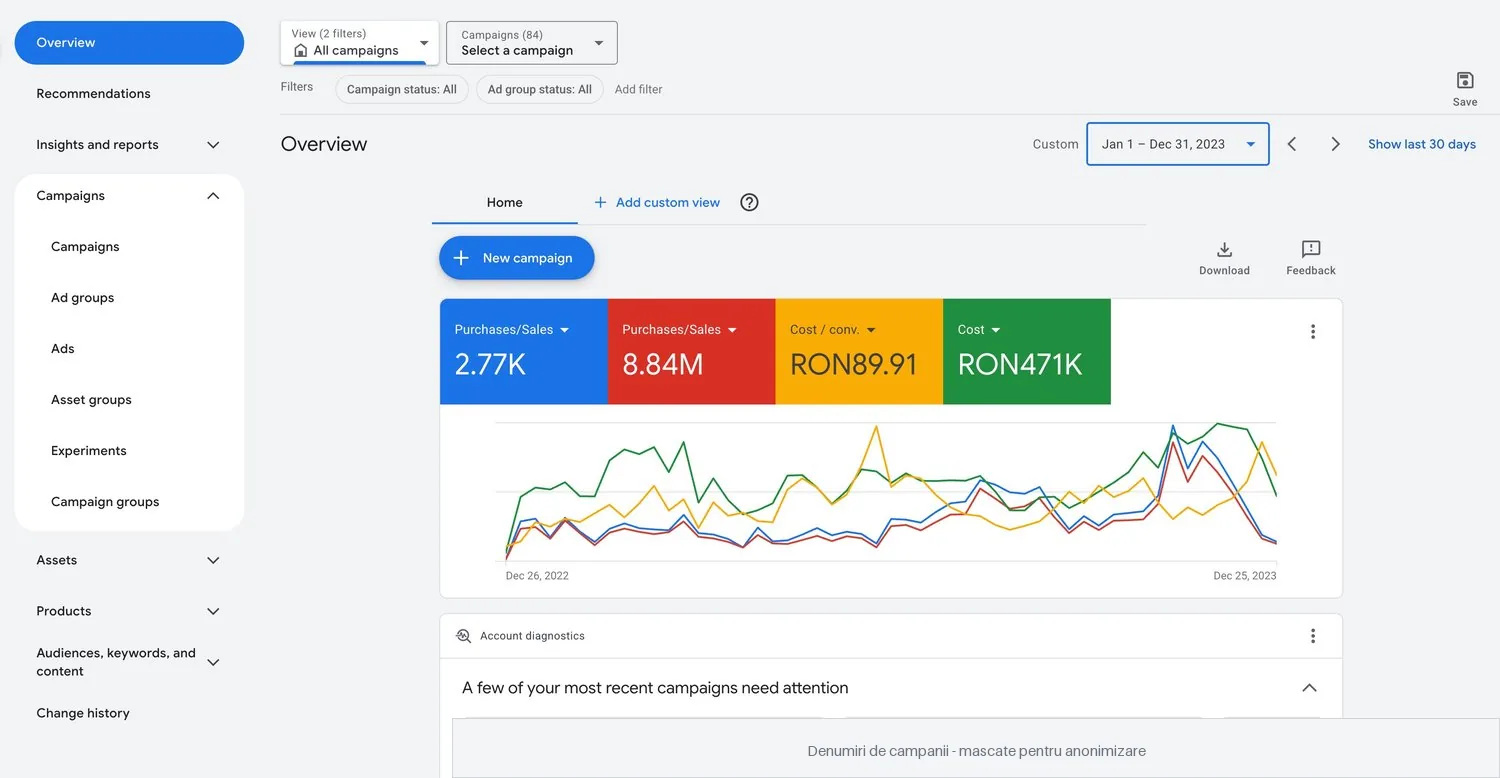
The shape of growth · 2022 → 2023
2023 was not a year of consolidation — aggregate data shows sessions +152%, total sales +21.5%, orders +5%, AOV +8%. Substantial traffic scaling.
Growth came from two concurrent patterns: a large increase in traffic, with sessions nearly tripling, and a concentrated Q4 peak. November delivered RON 4.08 million in one month — 26% of the year.
This pattern set the direction for 2024: how to extend Q4's effect into the rest of the year and reduce dependence on one quarter?
Performance by channel
Meta Ads
Google Ads
TikTok Ads
TikTok joined the mix in 2024. In 2023, the focus remained Meta + Google + Email.
Email · Shopify Email
Email migrated to Shopify Email in 2023. Its contribution is included in Shopify Analytics totals without separate reporting.
Monthly performance · Shopify
Spotlight · November 2023
November 2023 was the partnership's first major volume peak. RON 4.08 million total Shopify sales — 26% of the year in one month. 1,267 orders, with Black Friday baskets above the annual average. Conversion rate: 0.64%, the annual peak.
The advertising component: RON 177 thousand total spend (RON 120 thousand Meta + RON 57 thousand Google) → RON 4.21 million summed platform-attributed value (RON 2.46 million Meta + RON 1.75 million Google) → aggregate reported ROAS 23.9×. Meta attributed 752 purchases, Google 536 conversions. Platform-attributed values overlap and must not be added as revenue. Shopify sales of RON 4.08 million remain the commercial reference.
Discounts were used sparingly. November returns were −RON 109 thousand, the lowest of the year in its highest-volume month.
A key detail: November was the volume peak, but August was the combined efficiency peak — reported Meta ROAS 22.24× and Google ROAS 34.7×. Summer provided the tests; Black Friday put them into practice.
December then brought a reversal: −RON 1.29 million in returns from post-Black Friday refunds and RON 864 thousand total sales. Meta and Google continued delivering reported ROAS of 17.06× and 15.3×, while cash flow adjusted after Black Friday.
2023 strategic context
The Hydrogen experiment
Migration to Shopify Hydrogen, consent mode v2 and tracking/checkout issues. Visible in the data: April total sales of RON 722 thousand, reported Google ROAS 11–13× in April–June and −RON 648 thousand returns in October.
The operational decision: return to the standard Shopify theme. Recovery came in Black Friday season, and November's RON 4.08 million peak settled the Hydrogen discussion.
The August anomaly
August 2023 delivered reported Meta ROAS 22.24× and Google ROAS 34.7× in a month the source describes as quieter for competition. Lower spend — RON 32 thousand Meta + RON 33 thousand Google — coincided with high efficiency. The data suggests the system could operate efficiently in summer too.
Structural changes
Hydrogen trial and return to Shopify. Full-funnel Meta consolidation on the account with retained history. Google Ads scaling focused on Q4. Klaviyo → Shopify Email migration. Refined Black Friday offers with limited discounts in the highest-volume month.
The shape of the year: the structural lesson
Q1–Q3: building traffic; Q4: rapid expansion. 39% of sales concentrated in 3 months. This set the 2024 direction: extend Q4's effect and reduce dependence on a single quarter.
The 2023 lesson
“Sessions +152%, total sales +21.5%, and a RON 4 million November. In 2023, the system scaled both traffic and the seasonal peak. Q4 data is consistent with a repeatable system, rather than an isolated month.”
2024
The same 12 months. +65.6% sales. Improved reported Meta ROAS. A repeatable operating system.
If 2023 was testing, 2024 was execution. Total sales of RON 25.73 million (+65.6% YoY), orders 9,495 (+37%), returns reduced from 32% to 17% of gross sales. Meta scaled from RON 476 thousand spend in the partial April–December 2023 period to RON 896 thousand spend over a full year, with reported ROAS of 21.67×. Google delivered +47% attributed value with reported ROAS maintained at 18.92×. Four campaigns in the internal [ALS] system accounted for 56% of Meta spend and 70% of attributed value, with average reported ROAS 27×. H1 was rebuilding and H2 delivered the returns: reported Meta ROAS H1 15.8× → H2 25.7×.
Annual snapshot
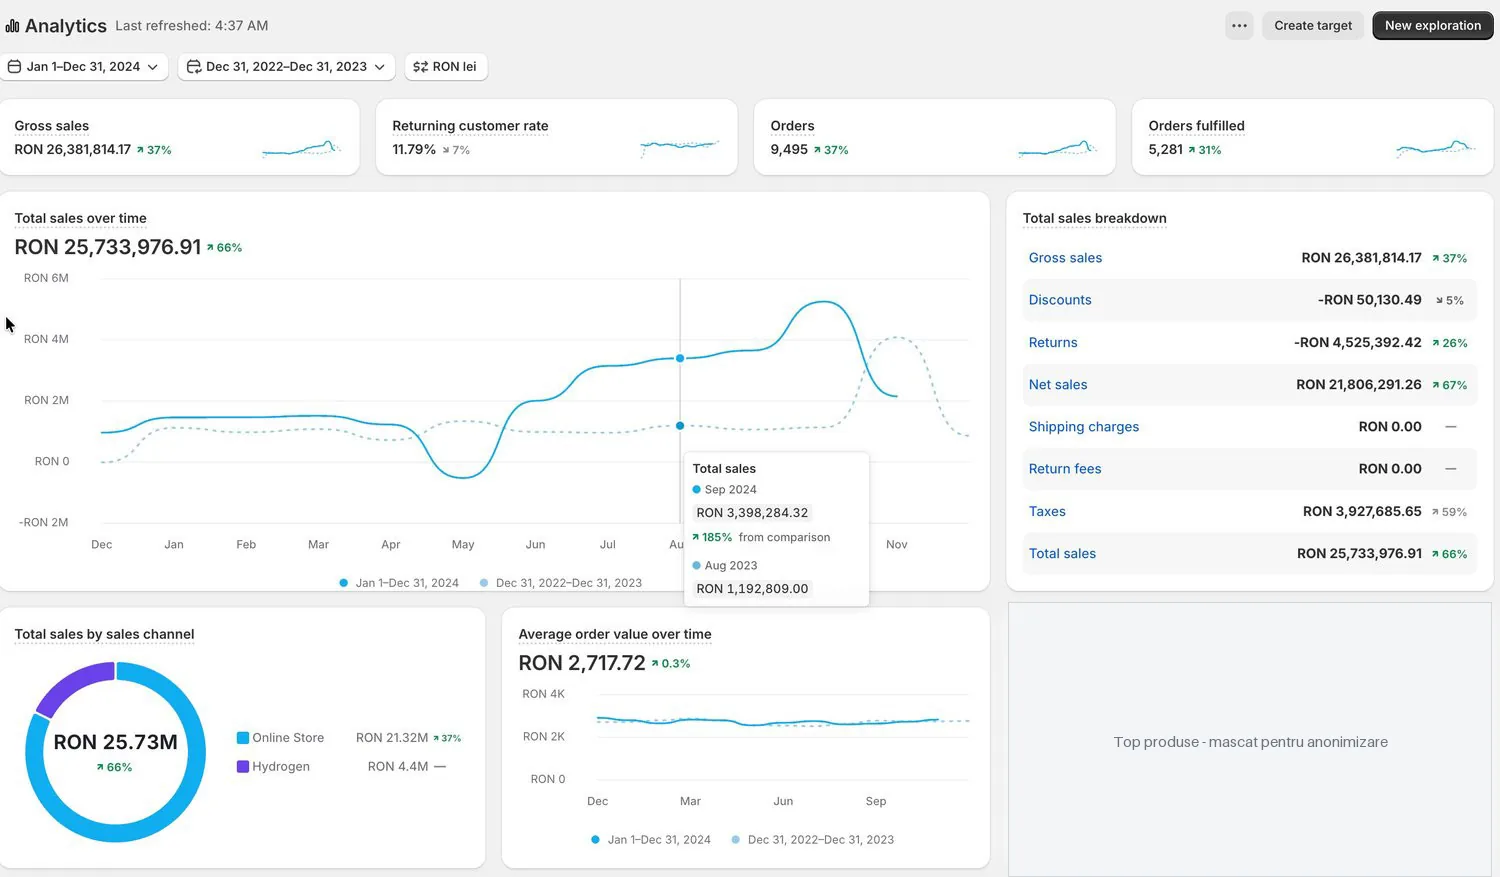
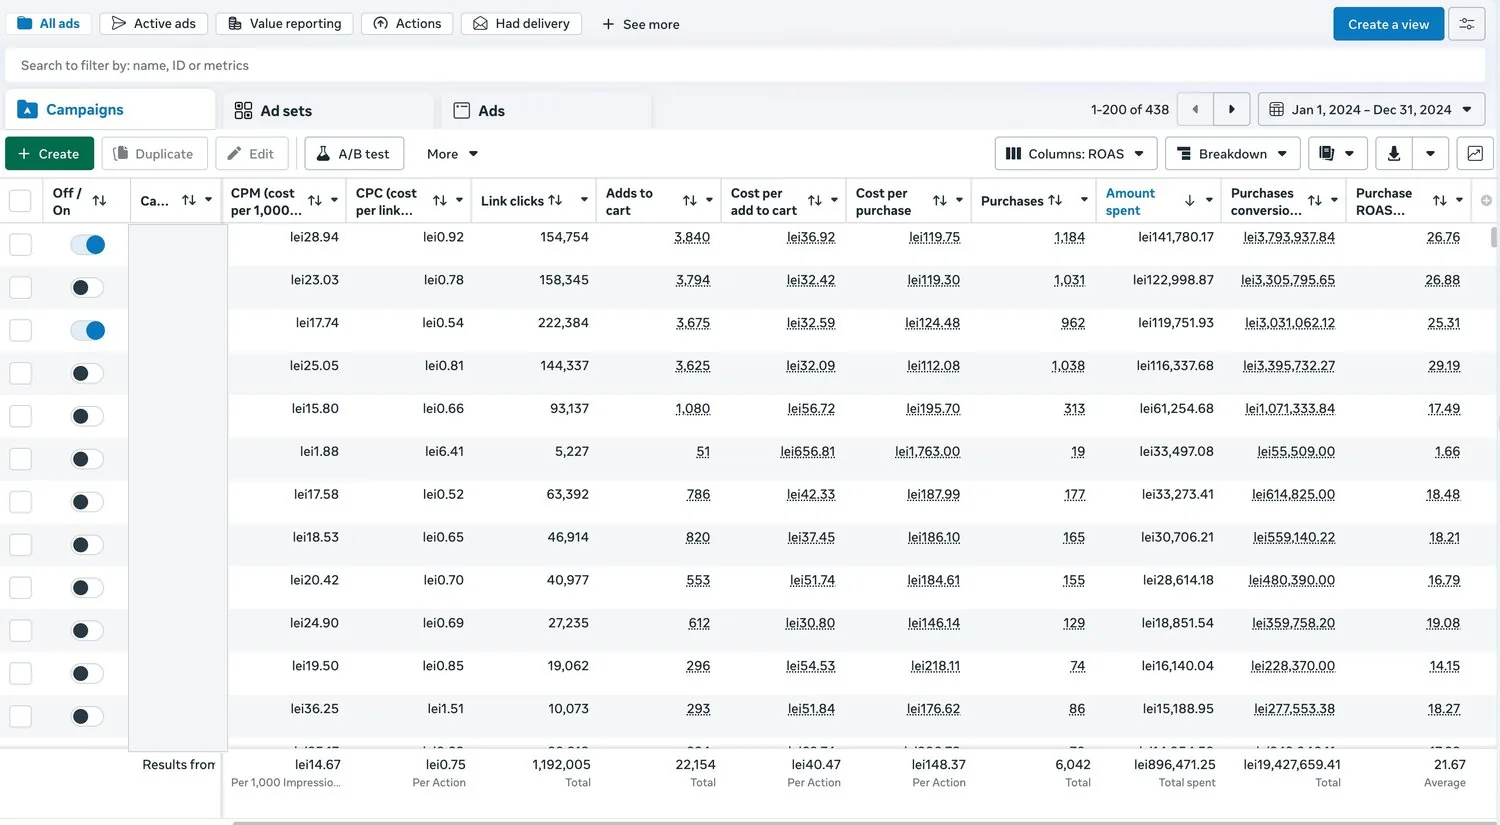
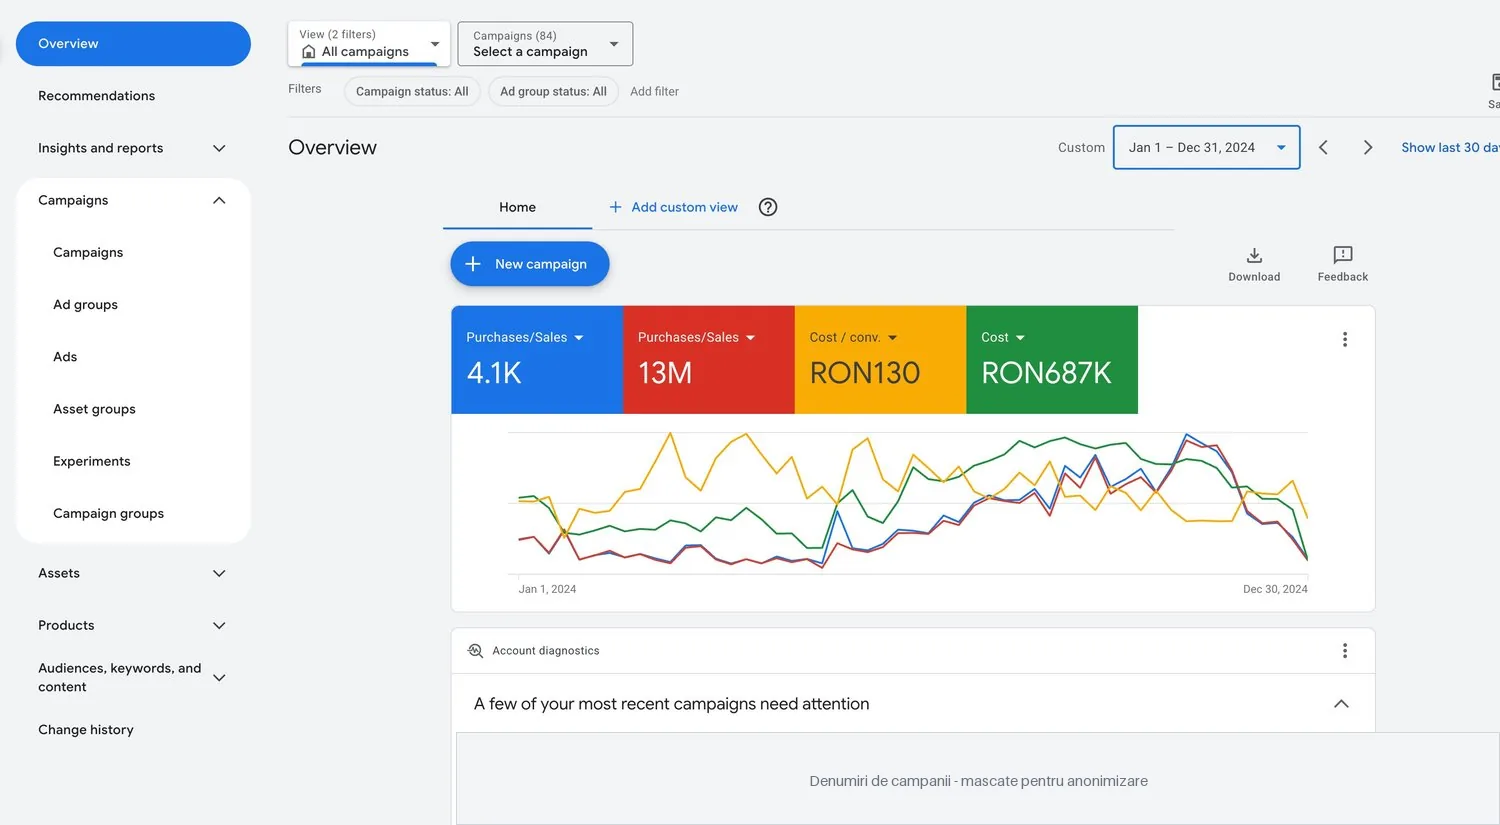
The shape of growth · 2023 → 2024
2024 was more than a repeat of 2023: it was a different growth pattern. Sessions +8%, versus +152% in 2023, while orders +37% and total sales +65.6%. Orders grew faster than sessions.
Contributing factors: (1) a repeatable creative and targeting system — the top 4 Meta [ALS] campaigns accounted for 70% of attributed value at average reported ROAS 27×; (2) an extended strong season — the second half accounted for 76% of annual sales; (3) returns under control — November, at 5.26 million, had proportionally fewer returns than November 2023.
The pattern shaped investment in 2025 infrastructure: evaluating Shopify Plus, strengthening the video team and planning the brand image.
* Meta figures for 2023 cover only 27 April – 31 December; comparison with the full year 2024 is indicative.
Performance by channel
Meta Ads
Google Ads
TikTok Ads
TikTok joined the mix in 2024 as a low-budget testing channel, around RON 250–500/day. Its 2024 campaign history is no longer available in the account, so the period is marked unavailable without estimates. 2024 marked the brand's TikTok debut; the channel became more relevant in 2025–2026.
Reconciled view
Monthly performance · Shopify
Spotlight · November 2024
November 2024: the data indicates a system that improved as volume increased. RON 5.26 million total Shopify sales, +29% versus November 2023's 4.08 million; 1,937 orders versus 1,267 a year earlier (+53%).
The advertising component: RON 203 thousand total spend (RON 128 thousand Meta + RON 75 thousand Google) → RON 6.37 million summed attributed value (3.77 million Meta + 2.6 million Google) → aggregate reported ROAS 31.4×. Meta attributed 1,174 purchases, Google 781 conversions. Attributed values overlap across platforms; Shopify sales remain the reference.
Black Friday YoY: spend +14% (RON 177 thousand → RON 203 thousand), summed attributed value +51% (RON 4.21 million → RON 6.37 million), aggregate reported ROAS from 23.9× to 31.4×. The same month, with improved infrastructure.
The key lesson: Black Friday spend rose 14%, while aggregate reported ROAS increased around 31%. The data is consistent with a more repeatable system, rather than growth solely from a larger budget.
2024 strategic context
The internal [ALS] system, made repeatable
Four main campaigns — 30-day retargeting, Advantage+ video, Advantage+ images and 180-day buyers — accounted for 56% of spend and 70% of attributed value, at average reported ROAS 27×. This involved a creative, targeting and bidding system iterated in 2023 and made repeatable in 2024.
Implication: Allocating 56% of budget to 4 campaigns concentrates risk, supported here by reported efficiency. The remaining budget covered testing, offline conversions and brand presence.
In-house creative production, end to end
From 2024, the ALLSoft Agency team handled the full creative production process in-house: scripting, filming, actors, production and post-production. Creative moved from a bottleneck to operational infrastructure: consistent assets delivered regularly, supplying the [ALS] system with new variations.
The result: the same campaign structure continuously supplied with new creative, with reported ROAS maintained alongside +88% budget. Control over production supported faster iteration.
Dedicated full-time Shopify developer
Also from 2024, the brand had a full-time Shopify developer from the ALLSoft Agency teamfor ongoing store development, conversion improvements, custom functionality, maintenance and Shopify Plus migration preparation, without relying on external development providers.
Combining media buying + creative production + Shopify development under one team created an ecosystem in which the components supported each other.
Physical production lagging behind marketing demand
The signal emerged in April: reported Google ROAS 6.76× and cost/conversion RON 211. It intensified in Q4 with delayed deliveries, critical reviews and overloaded support. The second half accounted for 76% of sales, and physical production could not keep pace with demand.
The decision: additional operational consulting on order handling and customer service. The working principle: “Resolve the issue, do not assign blame” — acting as a partner.
Preparing Shopify Plus and brand image
Shopify Plus migration was evaluated and formally proposed in 2024 for implementation in 2025. The source rationale was that the completed-order rate of 40–50% after cancellations was not sustainable at scale. The proposal combined Plus with a 5% card-payment discount to support order completion.
Brand development through an ambassador was also planned, with recruitment and launch in 2025.
The shape of the year: the structural lesson
H1 2024 was rebuilding, with reported Meta ROAS 15.8×; H2 delivered 25.7×. 76% of sales in the second half. Q4's share rose to 43%, versus 39% in 2023. Dependence on Q4 remained, while August–October developed into a second strong period.
The 2024 lesson
“Meta spend +88%, improved reported ROAS. Sales +65.6% with orders +37%. The same 4 campaigns, consistently supplied with creative, accounted for 70% of attributed value. The marketing system became repeatable; the brand's physical production still needed to catch up.”
2025
The same 12 months. +74.9% sales. +76% orders. +107% in November vs 2024.
2025 brought the components together. Total sales RON 45.01 million (+74.9% YoY), orders 16,721 (+76%), fulfilled orders +101%, indicating almost doubled operational throughput. Early in the year, Black Friday 2024 backlogs still affected deliveries. May–June was the turning point, followed by migration to Shopify Plus + a 5% card-payment discount. The new brand ambassador launched in October. In November: RON 10.89 million in one month (+107% vs November 2024), representing 24% of annual sales. Returning customer rate rose +20% YoY, suggesting retention improved alongside acquisition.
Annual snapshot
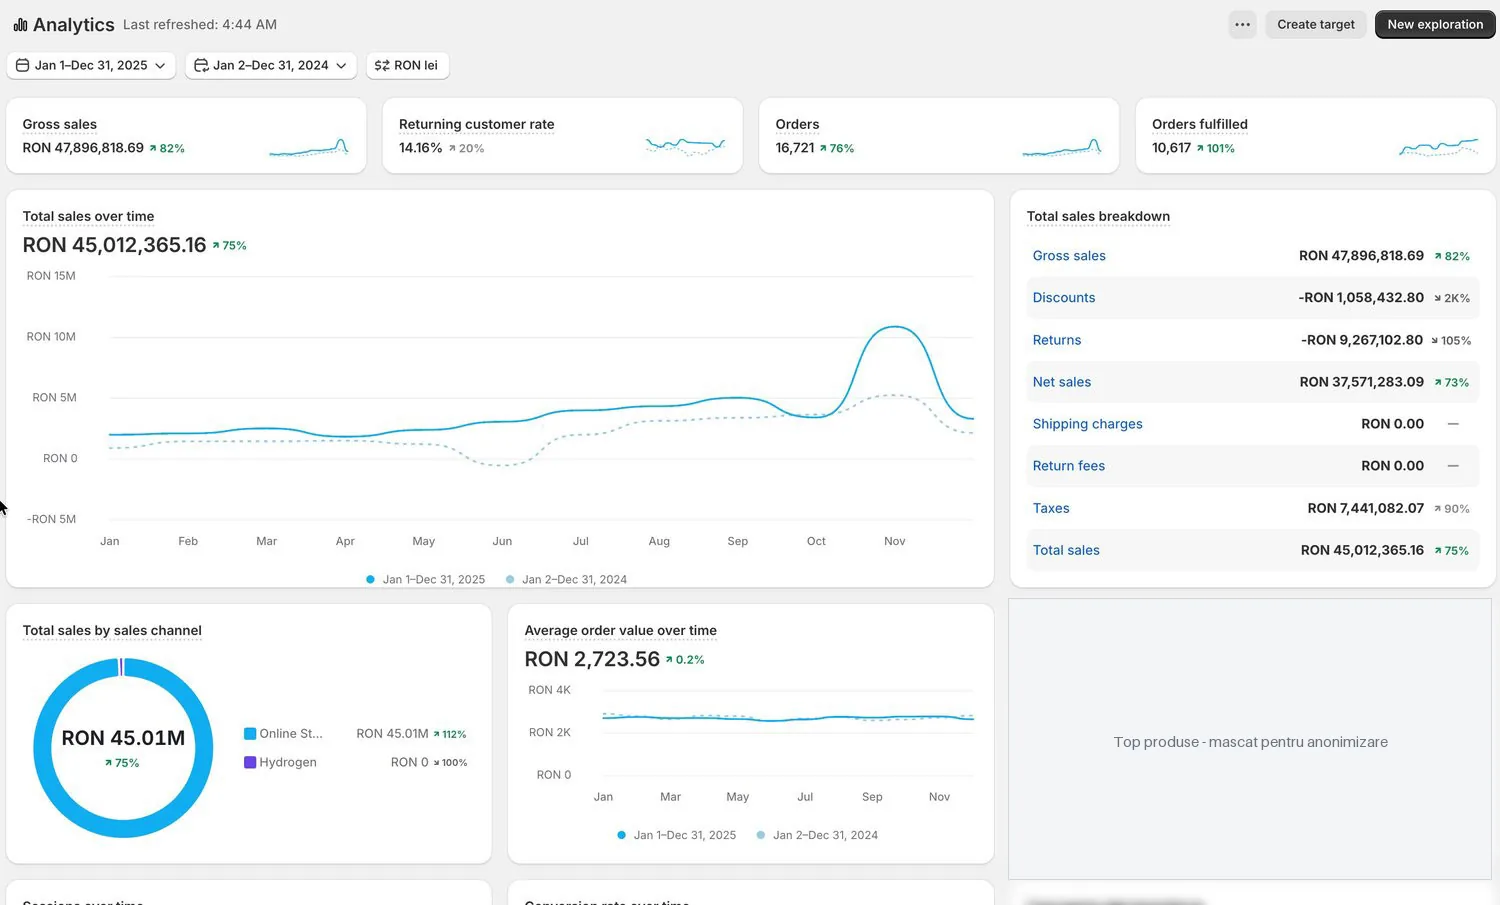
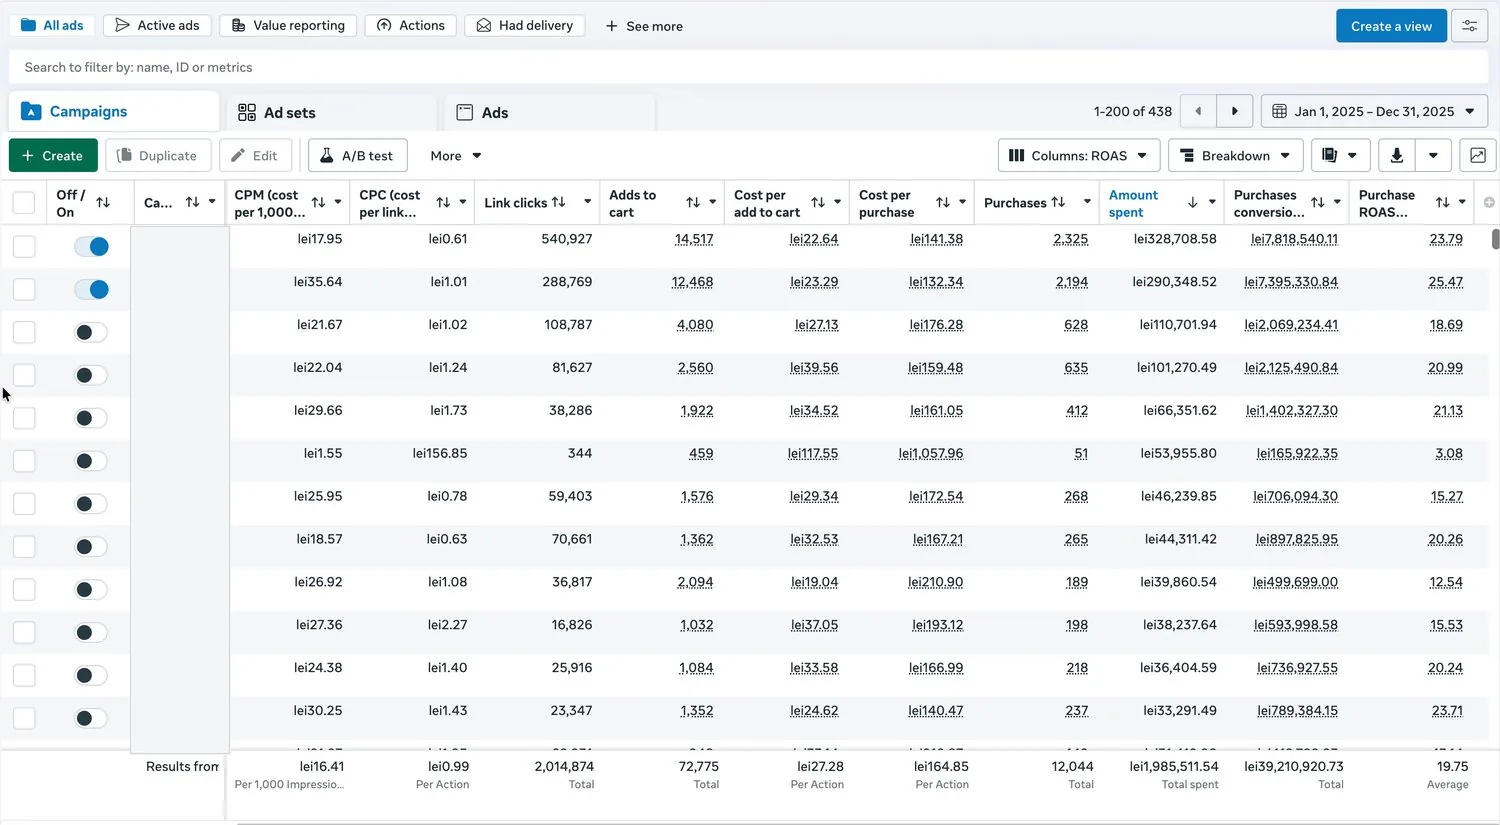
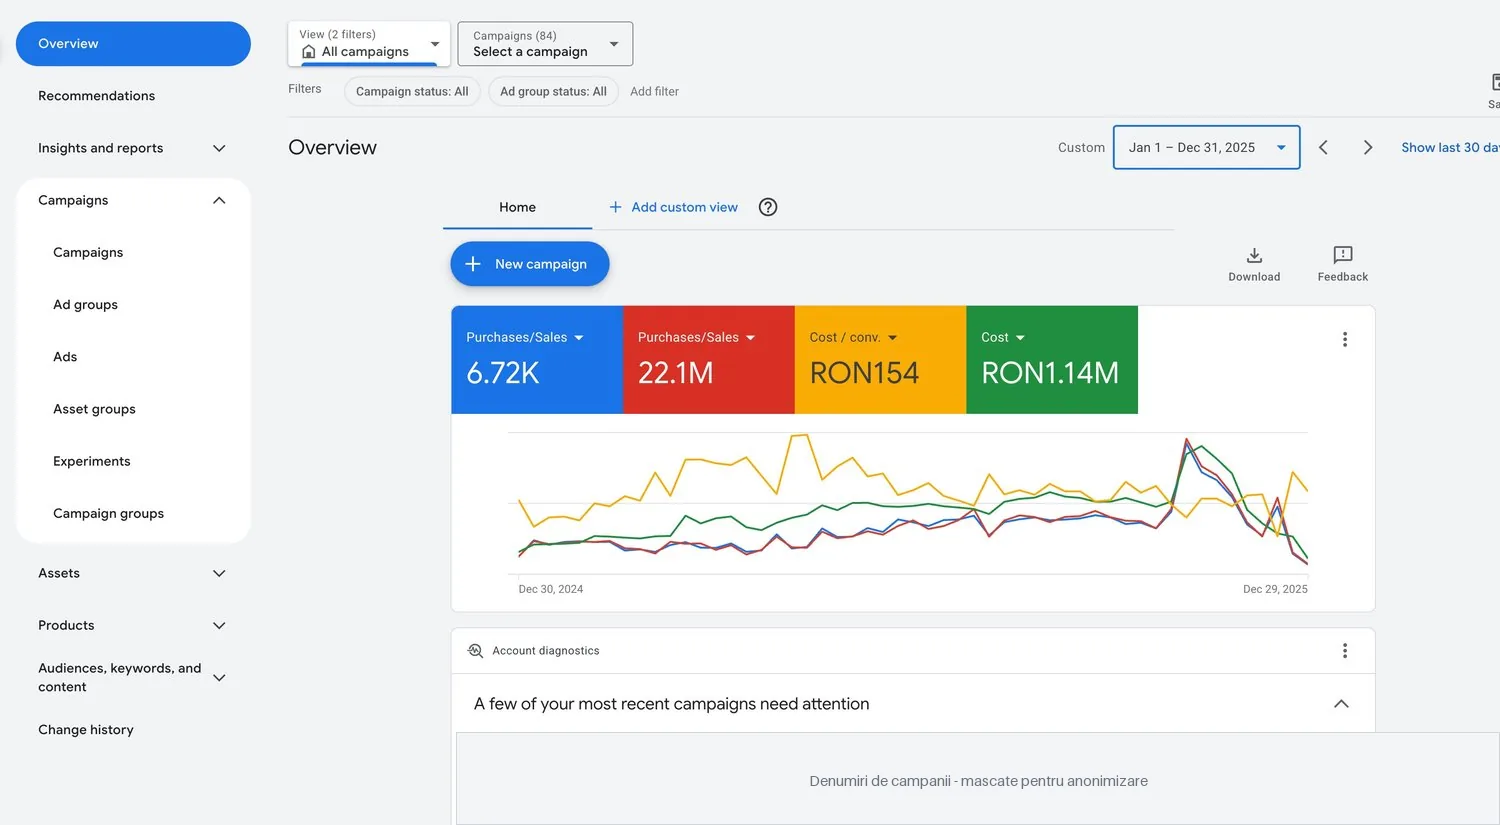
The shape of growth · 2024 → 2025
2025 brought a structural change. The same catalogue and core team, with new infrastructure — Plus and a 5% card-payment discount — a new brand ambassador and doubled operational throughput. Fulfilled orders +101% — the first year in which physical production kept pace with marketing.
The beginning of the year focused on clearing the Black Friday 2024 backlog . April, at 1.85 million, was the year's low. May–June marked the turning point, followed by stronger results from July onwards. October brought RON 2.24 million in refunds, 49% of the month's gross sales, coinciding with late settlements and the Plus transition.
November 2025 delivered RON 10.89 million in one month — close to the full year 2022 at 12.79 million. Relative to the month's Meta + Google spend of RON 571 thousand, MER for those channels was approximately 19, calculated as Shopify sales ÷ Meta + Google spend.
Performance by channel
Meta Ads
Google Ads
TikTok Ads
Brand image · ambassador
An ambassador was introduced as the face of the brand in October–November 2025 and remains active. Conversion impact cannot be measured directly as a paid attributed channel. In the same period, returning customer rate rose +20% YoY and premium positioning remained consistent with pricing. The exact contribution cannot be isolated from other factors.
Email · Shopify Email
Email continues through Shopify Email, now on Plus infrastructure. Its contribution is included in Shopify Analytics totals without separate reporting.
Monthly performance · Shopify
Spotlight · November 2025
November 2025 was the month in which the previously built systems operated together. RON 10.89 million total Shopify sales, +107% versus November 2024's 5.26 million, with 3,627 orders versus 1,937 a year earlier (+87%).
The operational combination: Plus infrastructure supporting volume, a 5% card-payment discount supporting completed orders, the brand ambassador, TikTok for Black Friday, Meta and Google, coordinated together. RON 571 thousand Meta + Google spend: Meta 399 thousand @ 24.83× reported ROAS / 2,943 attributed purchases + Google 172 thousand @ 23.72× / 1,200 attributed conversions → RON 13.99 million summed attributed value, aggregate reported ROAS 24.49×. Attributed values overlap across platforms and are not additional revenue; Shopify sales remain the business reference.
Black Friday YoY: spend +181% (RON 203 thousand → RON 571 thousand), summed attributed value +120% (RON 6.37 million → RON 13.99 million), orders +87%. Aggregate reported ROAS declined from 31.4× to 24.49× — an accepted trade-off for 2.8× greater investment in the peak month.
Cumulative comparison: November 2025 alone, at 10.89 million, approached the whole of 2022 at 12.79 million. In other words, 24% of 2025 in 30 days.
The key lesson: November's peak cannot be explained by one decision. It is consistent with the combined effect of four years of work: Plus, brand image, creative production, media strategy and operational support.
2025 strategic context
Recovery after Black Friday 2024 (Jan–Apr)
Early 2025 was dominated by clearing the Black Friday 2024 backlog: late deliveries, overloaded support and refund settlements. April, at 1.85 million with −580 thousand returns, was the annual low. Marketing could not accelerate until operations cleared the backlog.
May–June · the turning point
May (2.40 million) → June (3.07 million) , the first substantial increase of the year, coincided with clearing backlogs, preparing the Plus migration and stabilising operational capacity. This was the starting point for the stronger phase of 2025.
Shopify Plus + 5% card-payment discount
The actual Plus migration took place in June–July 2025, together with a 5% card-payment discount to address the persistent 2023–2024 order-completion issue: completed orders moved from 40–50% to 75–80%.
In the data: July 4.01 million (+31% versus June), August 4.35 million and September 5.04 million — the first three consecutive months above RON 4 million in account history.
October · settlements and ambassador launch
October 2025 brought RON 2.24 million in returns, 49% of monthly gross sales from late settlements on older orders and Plus transition adjustments. The same month marked the new brand ambassador launch. The refund peak was allowed to settle while preparing for November.
November · the RON 10.89 million peak
November 2025 combined four years of work: Plus, 5% card discount, brand image, the mature [ALS] Meta system, Google and TikTok for Black Friday. RON 571 thousand Meta + Google spend and RON 10.89 million Shopify sales produced MER of approximately 19 for those channels. Orders rose +87% versus November 2024.
TikTok · a conservative tactical decision
In 2025, paid TikTok ran only for Black Friday + December, with organic presence during the rest of the year. The reason was partial last-click attribution overlap with Meta during the peak window. The channel delivered 686 attributed purchases / RON 2.26 million attributed value , useful but managed conservatively.
The 2025 lesson
“2025 showed scaling with the components working together: Plus infrastructure, a 5% card discount for order completion, an ambassador for brand image, the [ALS] creative system and TikTok as a tactical addition. November's RON 10.89 million is consistent with four years of patient development. Physical production finally caught up with marketing.”
2026
2026 YTD. Sales grew faster than media investment.
Between 1 January and 21 August 2026, the store generated RON 28.34 million in total Shopify sales, 35.8% above the same period in 2025. Order count grew 20.4%to 9,417, while Shopify-reported AOV remained around RON 2,686.
Verified Meta and Google investment reached RON 1.96 million, 25.1% above the comparable period. Because Shopify sales grew faster than media spend, MER improved from 13.31 to 14.45. Meanwhile, aggregate platform-reported ROAS declined slightly from 17.73× to 17.23×. The right interpretation is that efficiency across the verified mix improved, not that each platform generated all the revenue.
Growth was uneven. January–May recorded strong increases, from 45.7% to 149.2% YoY. Growth slowed in June, while July and the first 21 days of August fell below comparable 2025 periods. This window included two structural changes: one category moved to a separate store, and Google Ads migrated between two consecutive accounts, with a gap showing no Google spend in the available data.
Returns recorded through 21 August were lower than in the comparable period, but recent cohorts are not mature yet. This is a favourable operational signal, not a final annual return rate.
Snapshot, 1 January–21 August 2026
| Metric | 2026 YTD | 2025, same period | Change |
|---|---|---|---|
| Gross sales | 28711122.71 RON | 21985423.81 RON | +30.6% |
| Discounts | −2136543.58 RON | −268779.57 RON | higher intensity; see margin note |
| Recorded returns | −3067272.26 RON | −4120405.81 RON | −25.6% in recorded value |
| Net sales | 23507306.87 RON | 17596238.43 RON | +33.6% |
| Total sales | 28343571.03 RON | 20869504.70 RON | +35.8% |
| Orders | 9,417 | 7,823 | +20.4% |
| Shopify-reported AOV | 2686.43 RON | 2681.22 RON | +0.2% |
2026 in two phases
Phase 1 · January–May: strong growth. Every month exceeded the comparable 2025 period, from +45.7% in March to +149.2% in April. April was the YTD peak at RON 4.61 million.
Phase 2 · June–August: slowdown. June grew only +6.1%, July fell −8.1% versus July 2025 and the first 21 days of August were −23.9% against the comparable period.
Two structural changes occurred in this window. In May 2026, a category with a distinct business model moved to another store , changing product mix and making subsequent comparisons less homogeneous. Google Ads also migrated between consecutive accounts, with no spend in the available data from 30 July to 16 August. We do not attribute summer's results to a single cause.
Monthly Shopify trend · 2026
| Month | Total sales 2026 | Orders | Shopify AOV | Recorded returns | Comparable 2025 | YoY change |
|---|---|---|---|---|---|---|
| January | 3692328.65 RON | 1,370 | 2546.89 RON | −555278.92 RON | 2008745.00 RON | +83.8% |
| February | 3480347.13 RON | 1,376 | 2486.23 RON | −688731.08 RON | 2115760.00 RON | +64.5% |
| March | 3680993.80 RON | 1,370 | 2453.99 RON | −718542.49 RON | 2526506.55 RON | +45.7% |
| April | 4610542.72 RON | 1,509 | 2616.09 RON | −283999.23 RON | 1849859.65 RON | +149.2% |
| May | 3739906.92 RON | 1,164 | 2857.50 RON | −468350.68 RON | 2400851.50 RON | +55.8% |
| June | 3260012.57 RON | 970 | 2881.44 RON | −127761.33 RON | 3073468.65 RON | +6.1% |
| July | 3680707.95 RON | 1,035 | 2976.28 RON | −118834.95 RON | 4006791.05 RON | −8.1% |
| 1–21 August partial period | 2198731.29 RON | 623 | 3012.25 RON | −105773.58 RON | 2887522.30 RON | −23.9% |
August compares only days 1–21 in both years. In May 2026, a category with a distinct business model moved to a separate store, changing product mix and making later comparisons less homogeneous. We do not automatically attribute the trend to one cause.
Meta Ads · 1 January–21 August 2026
| Metric | 2026 YTD | Comparable 2025 | Change |
|---|---|---|---|
| Spend | 1169821.03 RON | 941550.28 RON | +24.2% |
| Attributed purchases | 6,207 | 5,291 | +17.3% |
| Attributed value | 20229631.72 RON | 16764468.13 RON | +20.7% |
| Reported ROAS | 17.29× | 17.81× | −2.9% |
| Cost / attributed purchase | 188.47 RON | 177.95 RON | +5.9% |
Google Ads · two consecutive accounts
The historical account had spend through 29 July 2026. Windsor.ai data shows no Google spend from 30 July to 16 August. The new account has spend from 17 August, so only five complete days are included in this snapshot. The accounts did not run in parallel; their spend and results can therefore be combined for chronological coverage of the year.
| Metric | 2026, combined accounts | Comparable 2025 | Change |
|---|---|---|---|
| Spend | 791454.39 RON | 625919.93 RON | +26.4% |
| Attributed primary conversions | 4,477.24 | 3,753.53 | +19.3% |
| Attributed value | 13567535.39 RON | 11026008.90 RON | +23.1% |
| Reported ROAS | 17.14× | 17.62× | −2.7% |
| Cost / attributed conversion | 176.77 RON | 166.75 RON | +6.0% |
Reconciled view · Shopify, spend and MER
| Metric | 2026 YTD | Comparable 2025 | Change |
|---|---|---|---|
| Meta + Google spend | 1961275.42 RON | 1567470.21 RON | +25.1% |
| Sum of platform-attributed values | 33797167.11 RON | 27790477.03 RON | +21.6% |
| Aggregate platform-reported ROAS | 17.23× | 17.73× | −2.8% |
| Shopify total sales | 28343571.03 RON | 20869504.70 RON | +35.8% |
| MER for verified channels | 14.45 | 13.31 | +8.5% |
| Spend / Shopify sales | 6.9% | 7.5% | −0.6 pp |
What we can and cannot claim
What we can claim
- Total Shopify sales grew 35.8% YoY.
- Orders grew 20.4%, while Shopify AOV remained nearly stable.
- Meta + Google spend grew 25.1%.
- MER for verified channels improved from 13.31 to 14.45.
- Platform ROAS fell slightly, even as Shopify sales grew faster.
- After a very strong start, growth slowed during summer.
What we cannot claim
- that Meta and Google independently generated RON 33.80 million in revenue;
- that the difference versus 2025 was caused exclusively by marketing;
- that 2026 returns are final;
- that the category separation or Google account change alone explains July–August;
- that higher sales automatically mean higher profit;
- that the new Google account already has stable or historically comparable ROAS.
Methodology and limits
Contributing factors: the business source of truth is Shopify Admin / ShopifyQL, read directly from the store. Meta Ads is read through Windsor.ai with the default 7-day click + 1-day view window. Google Ads is read through Windsor.ai using primary conversions and their value, excluding “all conversions”, which would include actions beyond the primary purchases used in this study.
Data freeze date: data was extracted on 22 August 2026, with the public period limited to 1 January–21 August 2026. 21 August is the last complete calendar day, although attribution for recent ads may still update.
Limitations: 2026 is incomplete; recent return cohorts are immature; Google accounts were combined only because they ran consecutively, not in parallel; available data shows no Google spend from 30 July to 16 August; separating a category into another store from May 2026 makes later comparisons less homogeneous.
The YTD 2026 lesson
“In 2026 YTD, Shopify sales grew 35.8% while verified media spend rose 25.1%, improving MER from 13.31 to 14.45. After a very strong start, growth slowed over summer amid two structural changes. The data indicates a more efficient business mix, not a single cause, and the year remains incomplete.”
Cross-year insights
Patterns from four years of scaling the same brand: repeated observations developed into an operational framework.
The shape of growth matters beyond aggregate volume
Annual totals can hide the story. Monthly distribution helps distinguish a repeatable pattern from an isolated peak. In 2023, annual growth was +21.5%, but November alone represented 26% of sales.
Tracking integrity matters more than platform features
The 2023 Hydrogen episode coincided with falling reported ROAS across channels. Stable measurement infrastructure matters more than isolated optimisations.
Summer for testing. Black Friday for execution.
August 2023: reported Meta ROAS 22.24× and Google ROAS 34.7×. Quieter months allow structure testing; Black Friday applies validated work.
Your own data exports provide protection
Losing Meta's 2022 history led to automated monthly cloud exports for all managed accounts. The practice spread across the agency's workflow.
Methodology
Sales, orders, AOV, discounts and returns come from Shopify and define the store's business figures. Meta and Google use their own attribution models and windows; multiple platforms can claim the same order. Their attributed values therefore cannot be added as incremental revenue. For 2026, Meta and Google were read through Windsor.ai; Google accounts were combined only because they ran consecutively rather than in parallel. The data ends on 21 August 2026. The year, recent returns and recent attribution remain incomplete.
Want to explore similar growth for your business?
We audit your Meta Ads or Google Ads account free of charge and explain within 24 hours what is not working and why. No commitment or sales pitch.