
 Facebook Ads
 TikTok Ads
 Shopify
18 million dollars for a cosmetics brand. Almost a third in two months.
A US cosmetics and nail care brand, grown from a solid figure of around 1.2 million dollars a month to over 18 million dollars in total sales and 348,368 orders over four years. 2020 brought the surge: 13.7 million dollars in one year and a peak of 5.4 million in March and April. More than that: at the peak, conversion rate increased rather than falling.





18 million dollars, built on volume.
Over four years, the brand processed 348,368 orders at an average value of 53 dollars. This is a high-volume, low-order-value model where the real challenge is speed and scale, not price. Direct traffic generated 9.47 million dollarsaccording to Shopify attribution, alongside social media (5.13 million) and search (3.14 million). Returns remained at just 2.7% of gross sales, while 23.7% of customers returned.
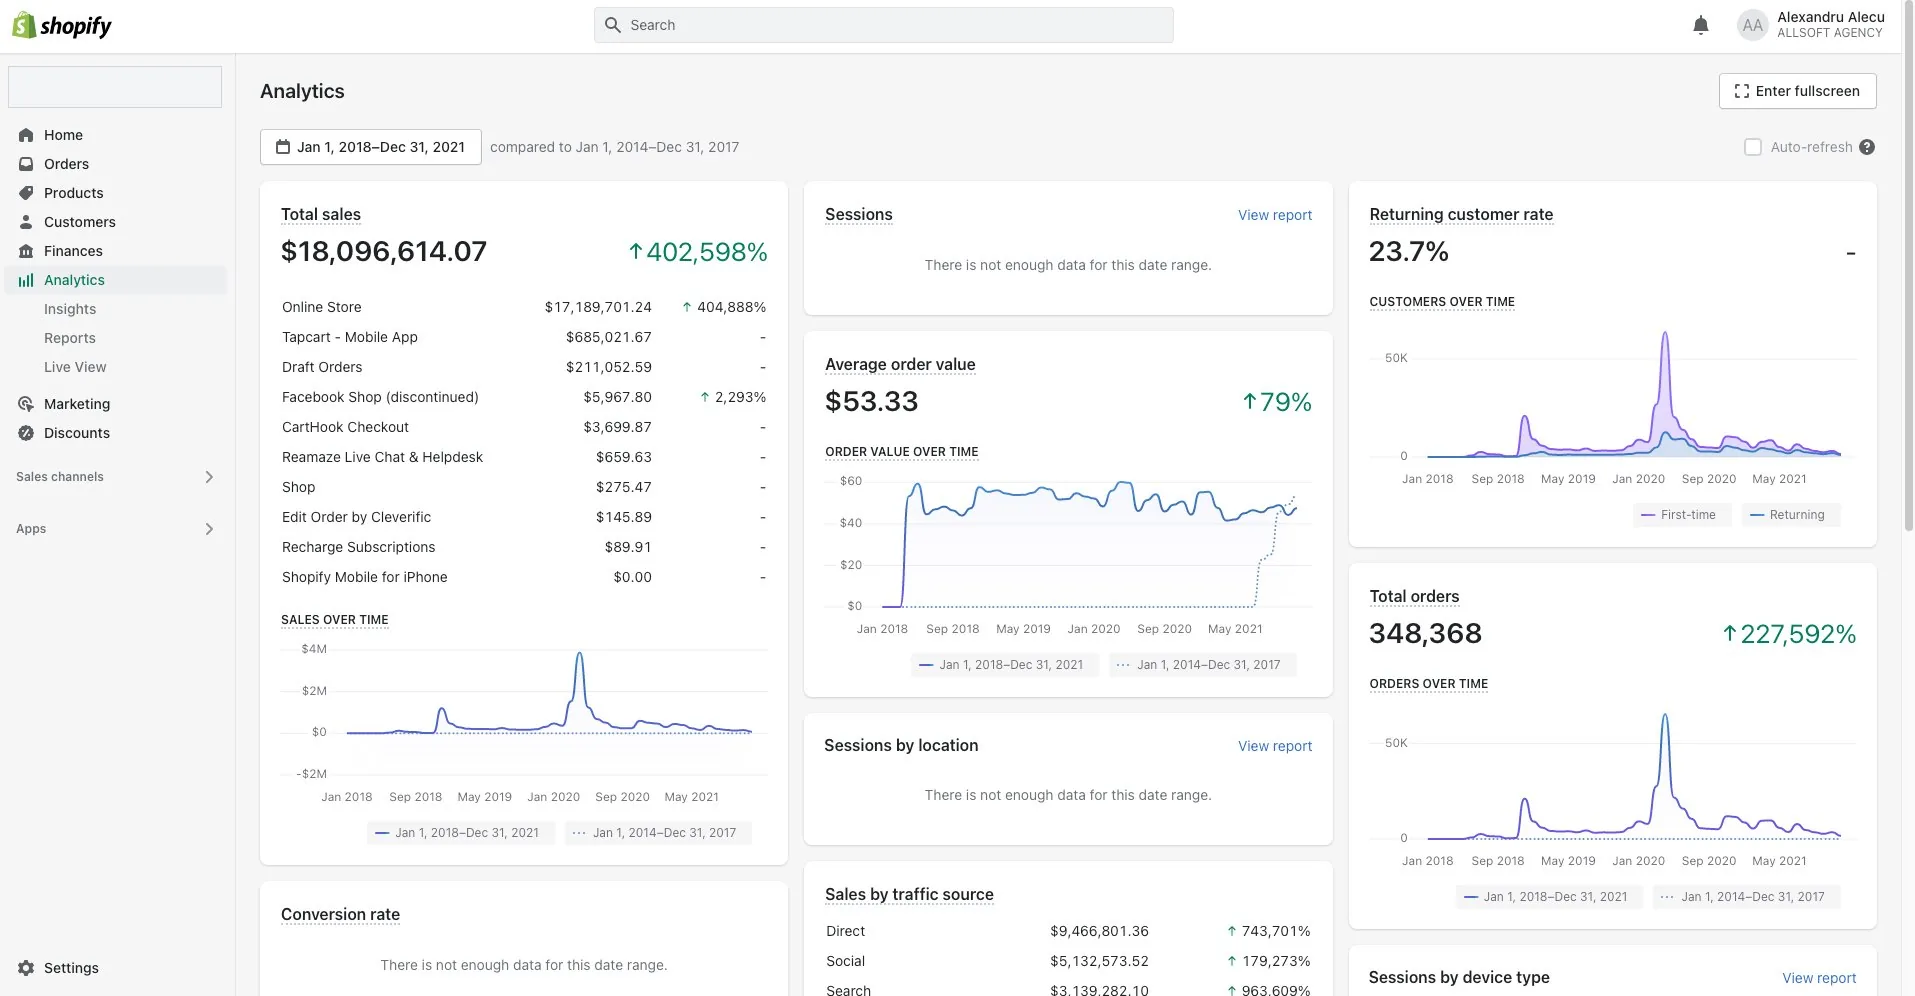
18,096,614 dollars in total sales, 348,368 orders, average order value 53.33 dollars. The sales curve clearly shows the explosive peak in spring 2020. Source distribution: direct traffic 9.47 million, social media 5.13 million, search 3.14 million.
One year brought 76% of the total.
2020 defined the brand: 13.7 million dollars in a single year and 265,295 orders. Three quarters of the entire four-year result, concentrated in twelve months. Growth started in March and took the brand to an entirely different scale.
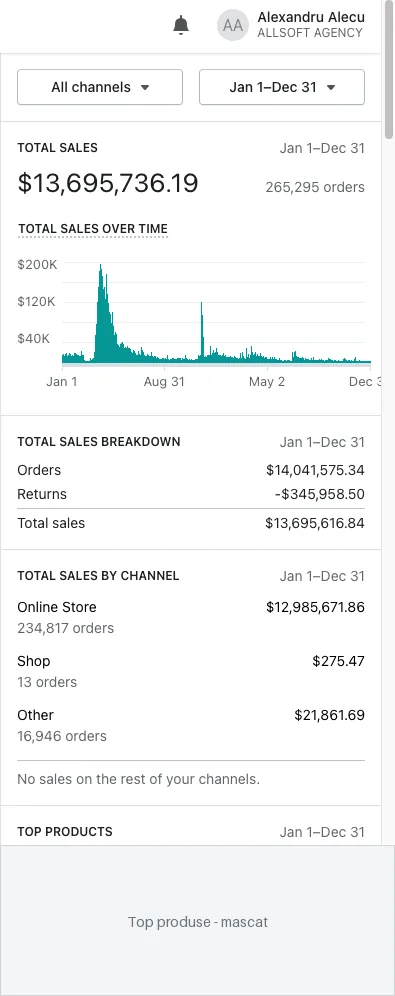
13,695,736 dollars in 2020 from 265,295 orders. The curve's peak in March and April shows a step change, rather than smooth growth.
Almost a third of the total in two months.
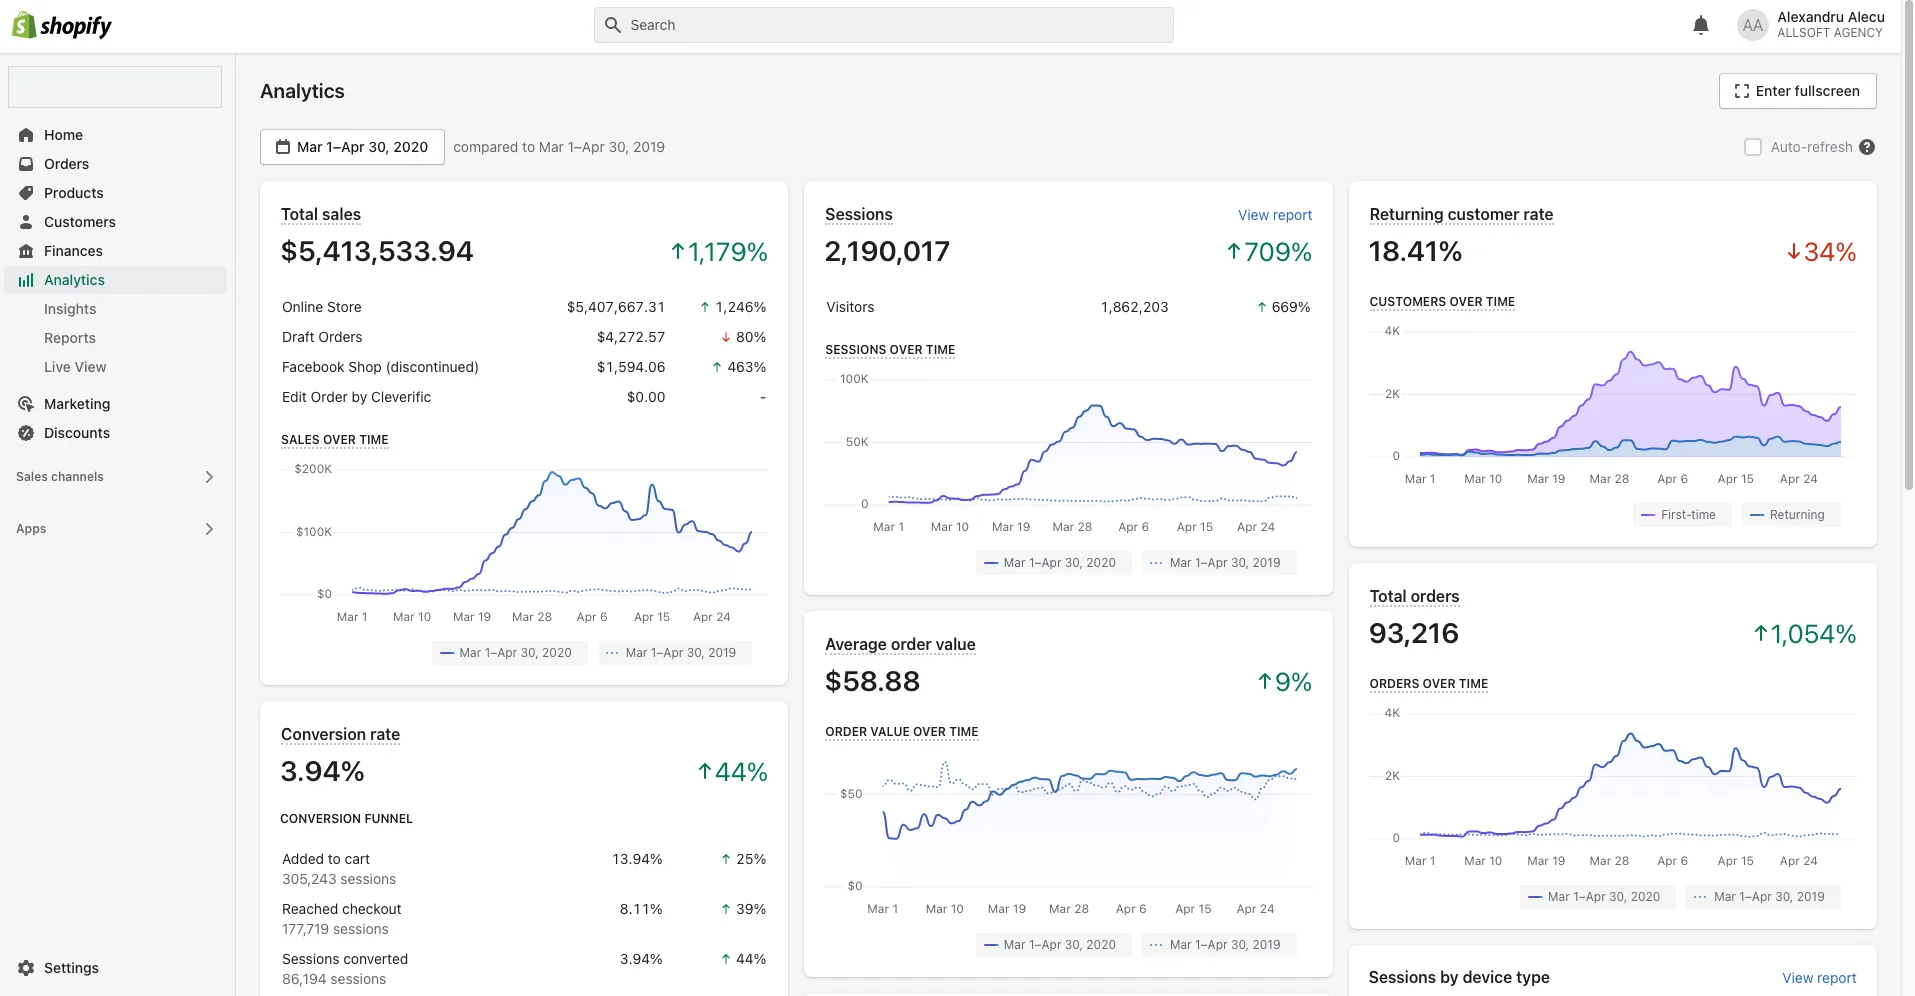
5,413,533 dollars in 61 days (up 1,179%), 93,216 orders (up 1,054%), 2,190,017 sessions (up 709%), conversion rate 3.94% (up 44%). Traffic growth and conversion rate growth appear in the same reporting window.
1.1 million in six days. An order every 26 seconds.
At the peak of the surge, the pace is difficult to grasp without figures. In six days (30 March–4 April), the brand generated 1.12 million dollars. On 31 March, in 24 hours, it generated 196,591 dollars from 3,376 orders: an order every 26 seconds, hour after hour, at a conversion rate of 4%.
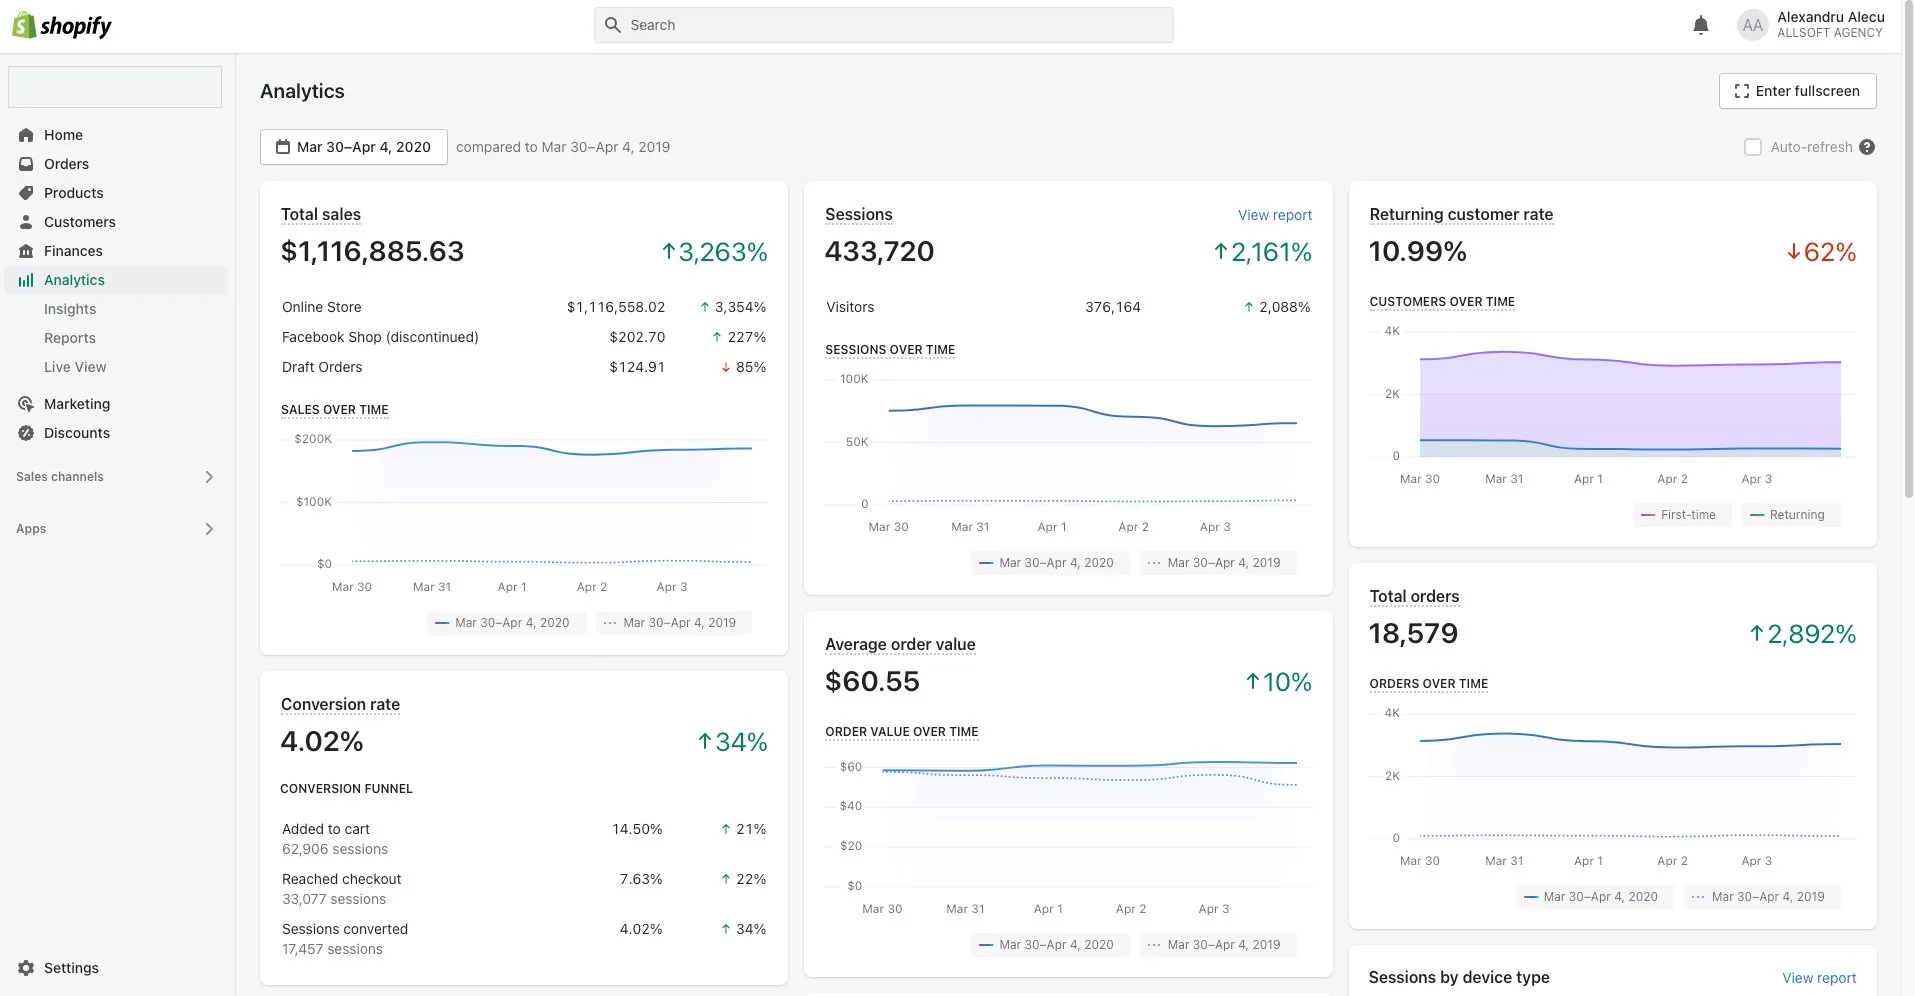
1,116,885 dollars in six days (up 3,263%), 18,579 orders, conversion rate 4.02%, average order value 60.55 dollars.
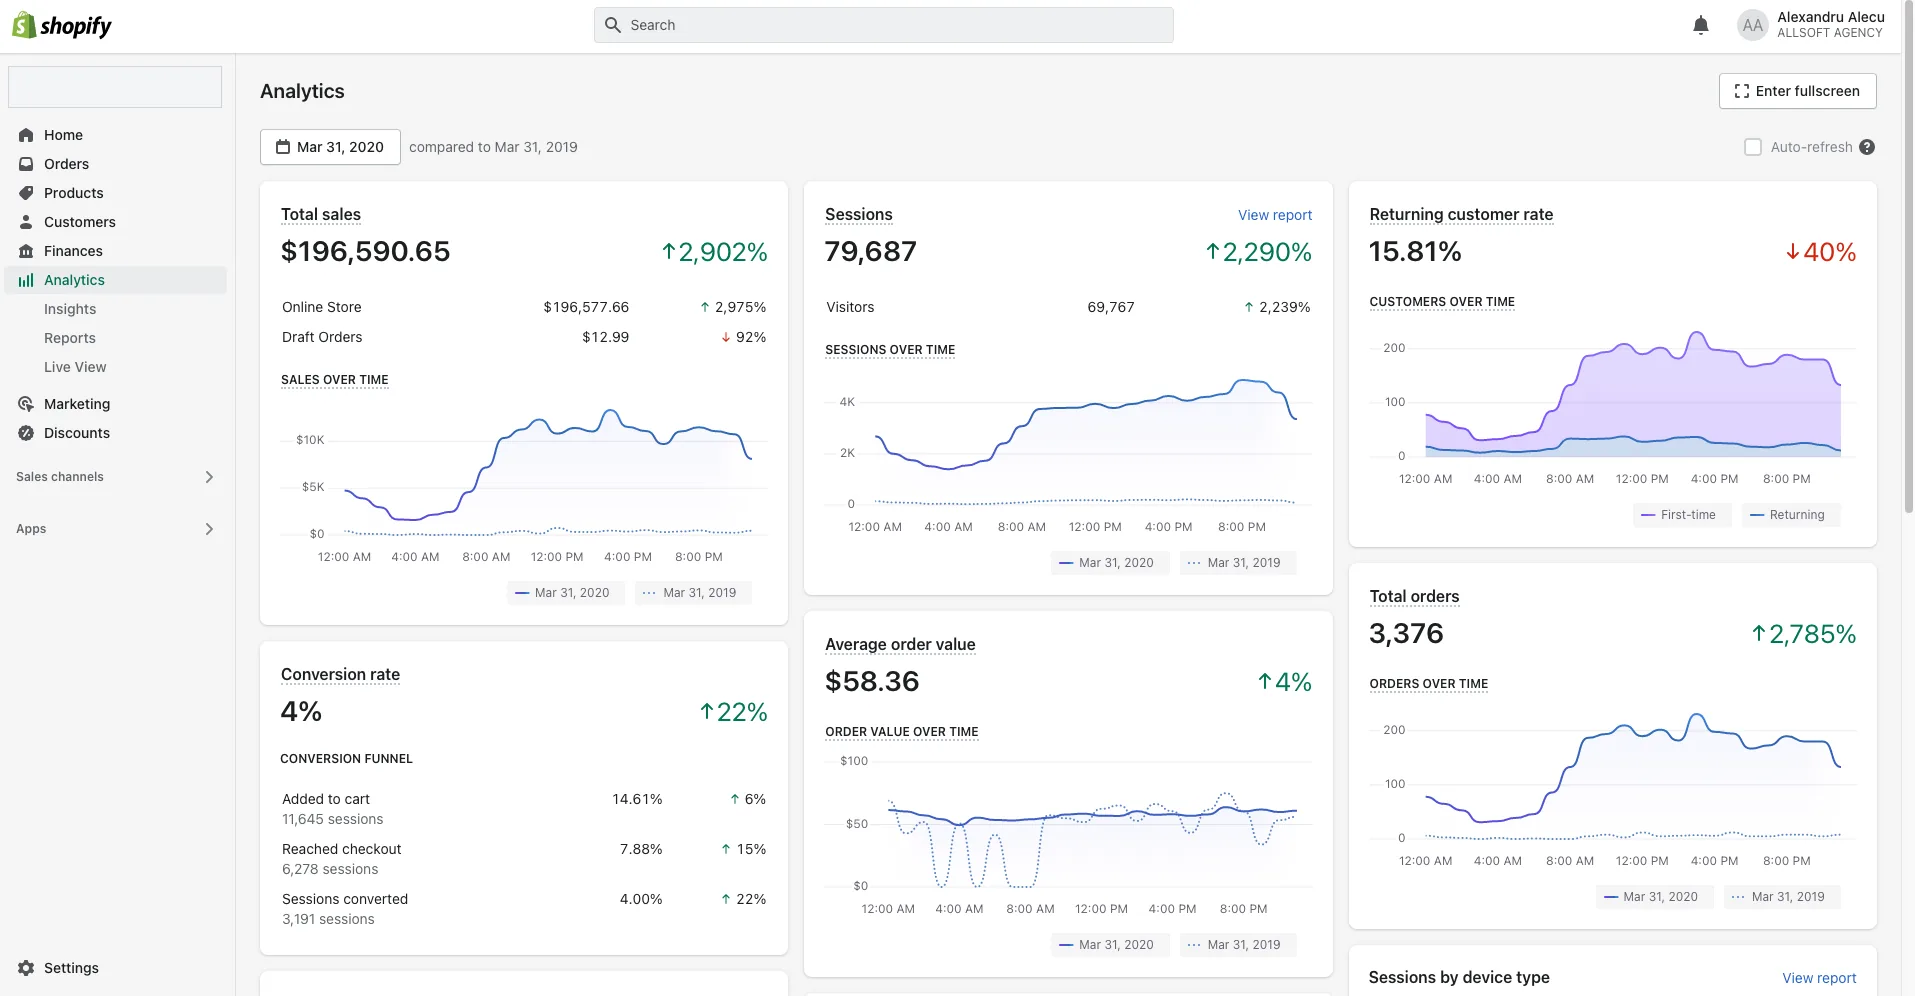
196,590 dollars in a single day (up 2,902%), 3,376 orders in 24 hours, conversion rate 4%.
Traffic and conversion: read the periods separately.
In March–April 2020, Shopify reported a conversion rate of 3.94% against session growth of 709% compared with the comparable period. The chart below separately presents the reported intervals: March, both months combined and the peak days.
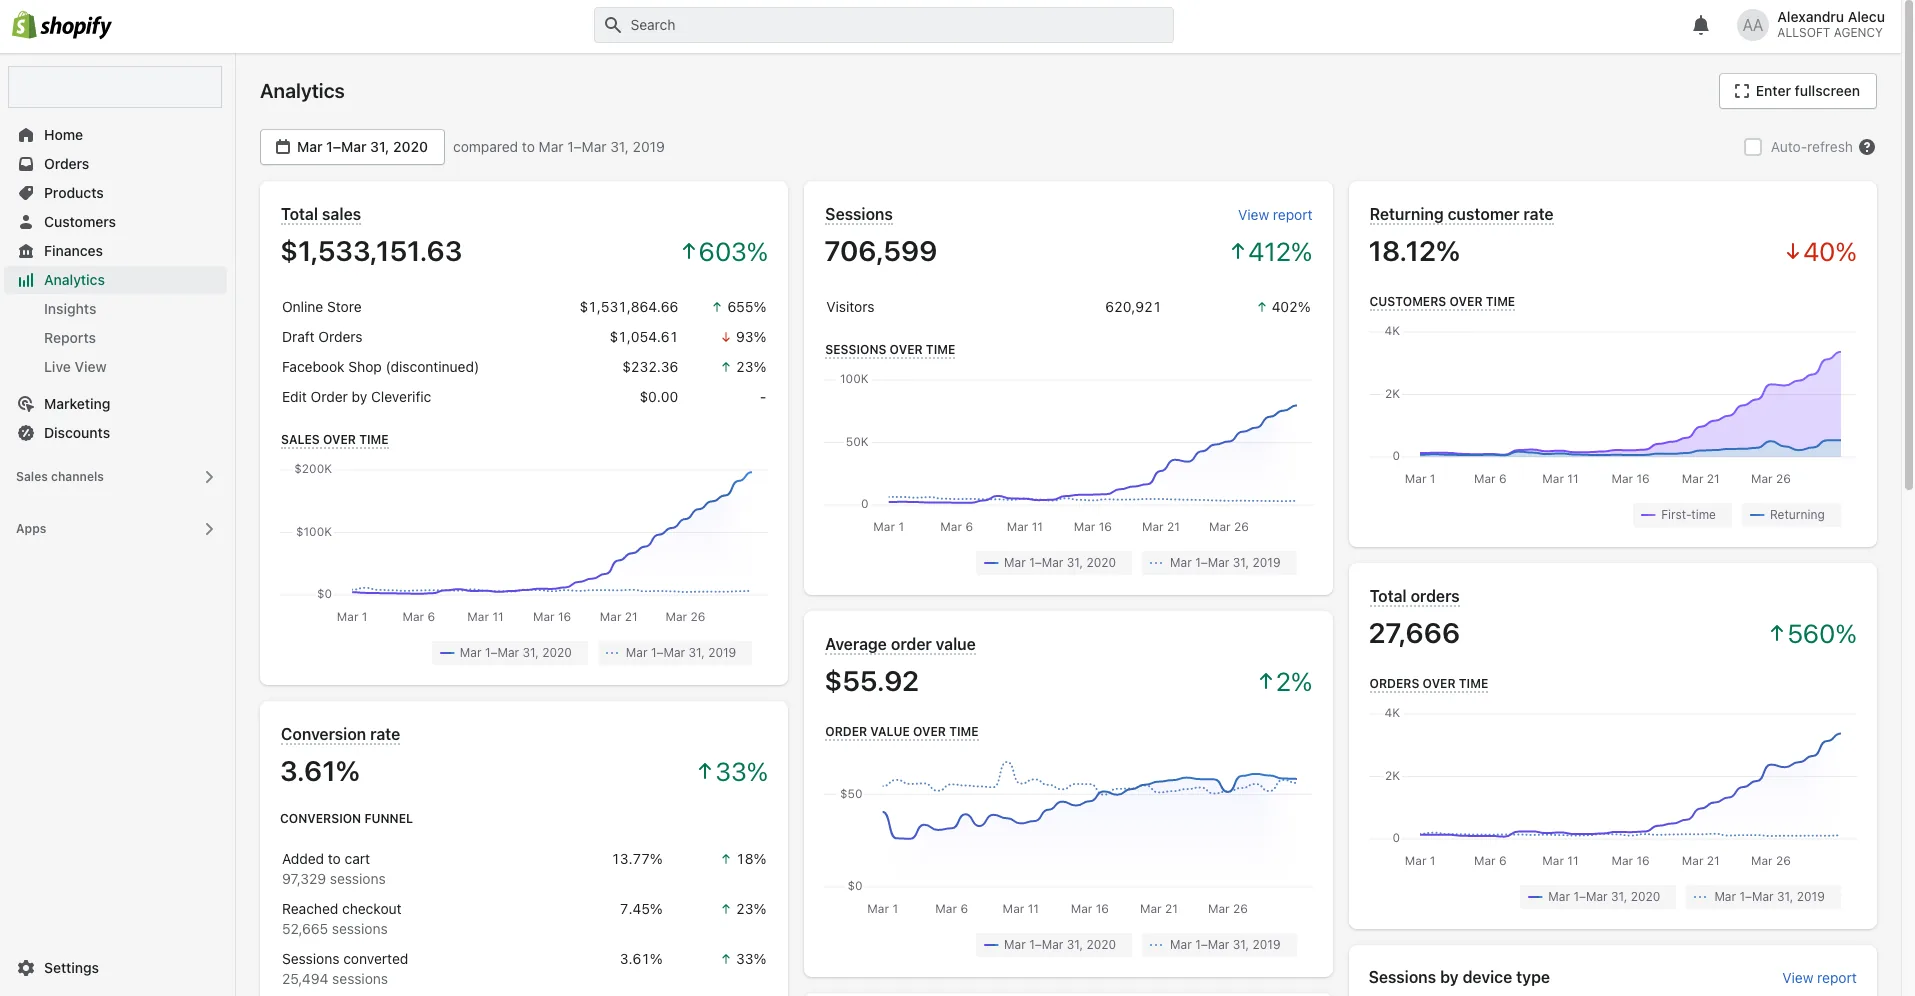
March 2020: 1.53 million dollars (up 603%), 27,666 orders, 706,599 sessions. The sales chart shows a rise from almost zero to over 200,000 dollars in a single daywithin 31 days, with average order value holding steady at 55.92 dollars during the surge.
A single entry product generated 1.59 million.
The volume did not arrive at random. The entry product was a low-priced trial bundle called the Glam Powder Trial Kit, used to bring customers into the store and open the way to higher-value orders. One product generated 1.59 million dollars from 43,075 units sold over the full period. That is the difference between running ads and building a sales system.
15 months before the surge, the brand was already generating 1.2 million a month.
The 2020 surge was not a market accident. As early as December 2018, long before the pandemic, the brand was already generating 1.21 million dollars in a monthfrom 21,128 orders and 740,419 sessions. The sales system already existed at scale. That is why, when the wave came, the brand could absorb it instead of collapsing under it.
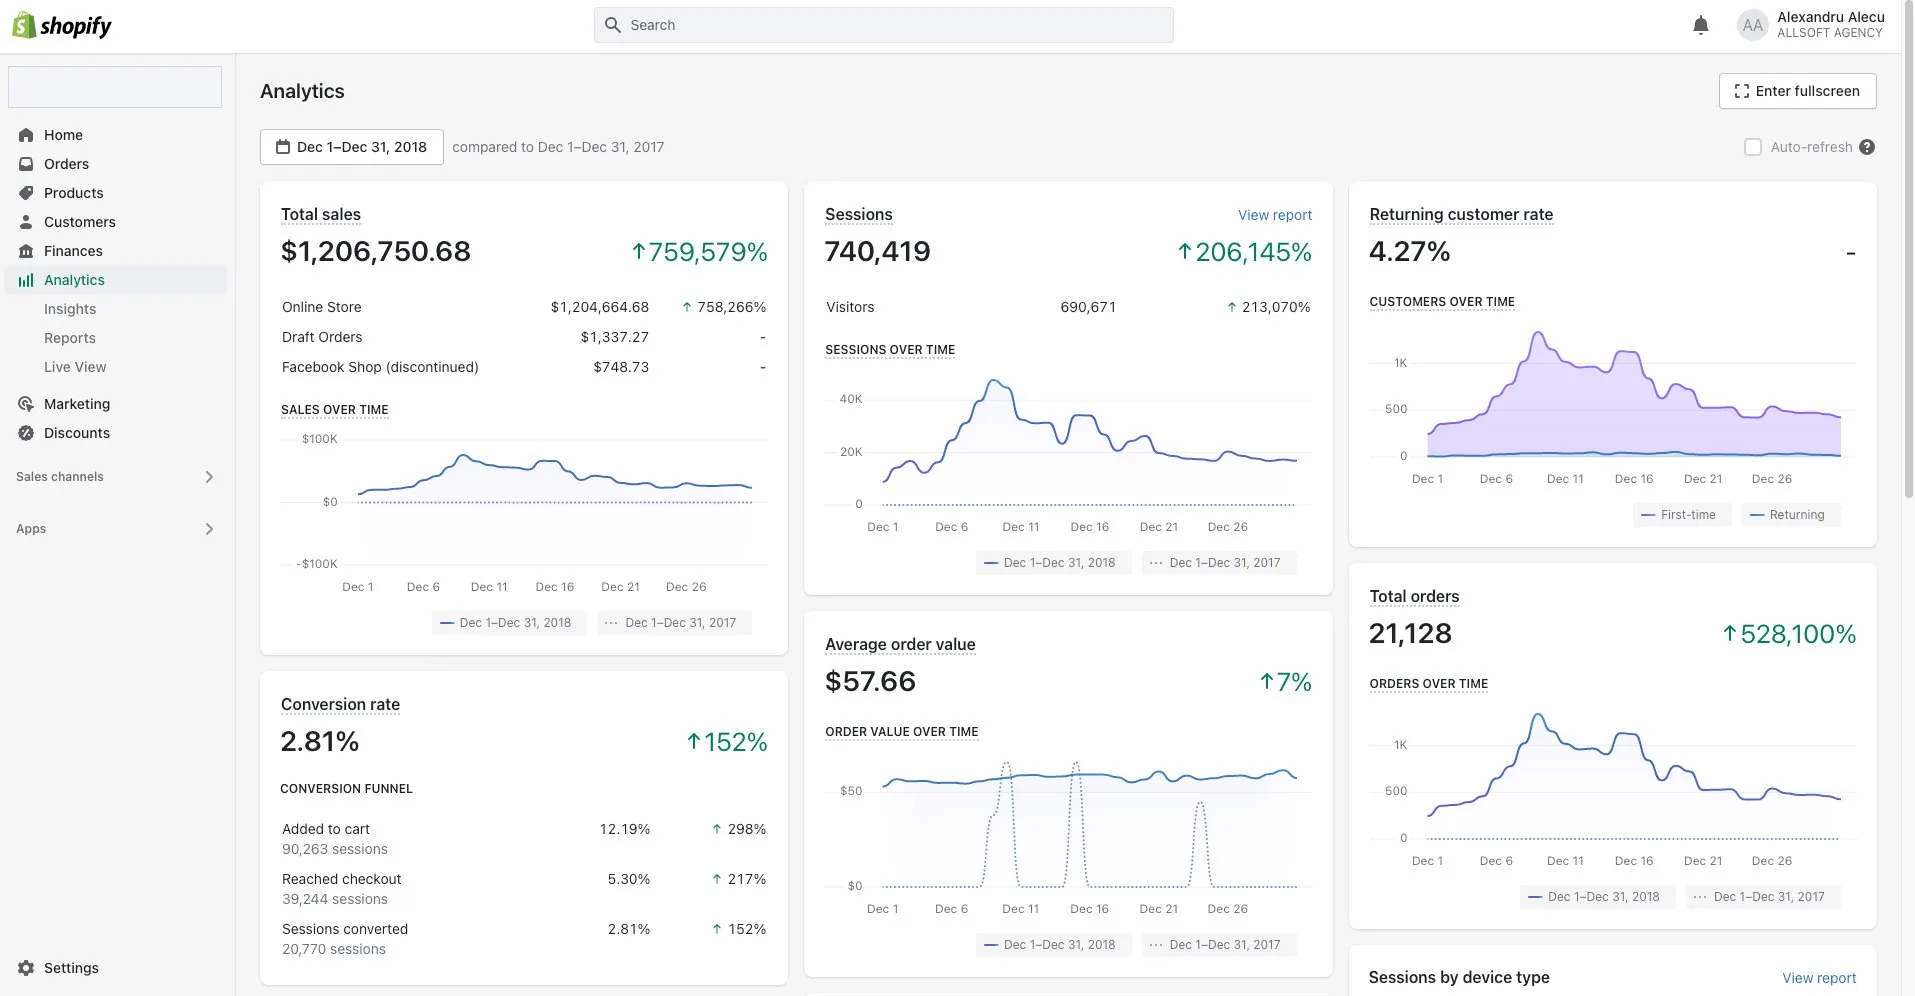
1,206,750 dollars in December 2018, 21,128 orders, 740,419 sessions. Evidence that the foundation existed more than a year before the 2020 peak, and that growth started from an already solid base.
All figures above come from Shopify Analytics, the source of truth for sales, orders and conversion rate. Advertising account data (Meta and Google) from 2018–2020 is no longer accessible: the account belonged to the client and the platform's retention period has expired. This situation underpins our current approach: automatic monthly exports to cloud storage for every account we manage.
Rapid growth, with conversion kept under control.
Growth speed
5.41 million dollars combined in March and April 2020: around 1.53 million in March and 3.88 million in April.
Conversion under pressure
2020 traffic growth and the conversion comparison with the 2018 reference describe different intervals. In March–April, Shopify reports 2.19 million sessions and a 3.94% conversion rate.
A real sales system
An entry product generating 1.59 million dollars and an average order value maintained at 53 dollars. Growth through brand awareness, not desperate discounts.
Infrastructure, not luck
1.2 million a month as early as 2018. The system was already built, allowing it to process 3,376 orders in 24 hours without breaking down.
Want similar results for your brand?
We analyze your Meta Ads or Google Ads account for free and tell you within 24 hours what is not working, why and what should change. No obligation.